In today’s telecom market there’s a strong appetite for rich analytics. It’s almost impossible for a SD-WAN vendor or an MSP to sell a solution or service without these features.
The question is, how much is it used? Is it really useful?
All SD-WAN vendors provide an analytics UI with two main features:
- A top down view, i.e. you can see all events and metrics as time series data. so if you know what you are looking for, such as troubleshooting a site link following a user complaint, you can find it.
- Threshold-based monitoring: customers can define thresholds to trigger an alarm when a set value is exceeded. For example if the round trip time exceeds 150ms for a given path or application an alarm can be triggered if the threshold is set to 150ms.
It sounds good in theory. But here is the problem:
First, the data with manual inspection quickly gets unmanageable. An SD-WAN VPN of 100 sites in a full mesh will result in about 250,000 graphs to display basic SLA metrics such as packet loss, latency and jitter (100*99 (full mesh) * 3 (metrics rtt/jitter/loss) * 4 (queues) * 2 (ISP circuits) = 237,600 time series graphs). So you’d better know what you’re looking for!
Second, static thresholds aren’t flexible enough. Normal packet loss looks very different on a given MPLS link vs an Internet link or an LTE link. Basic laws of physics tell us that RTT between London and Paris is not the same as New-York and Singapore. And so on. As a result, we’re limited to setting very high thresholds that are useful only for detecting major outages. Or we can set lower thresholds that may catch grey failures but also produce a constant stream of noise about events that are not operationally relevant.
So, if automatic monitoring doesn’t work efficiently, how can operators pay attention to all these graphs? How can they find grey failures so they can take preventive action before a service-impacting failure?
This is where Machine Learning comes into play, with real-time automated machine learning applied to all network performance metrics. Not just latency, jitter and loss but also MOS score, duplicate packets and retransmissions, server response time and any other metrics available from the SD-WAN infrastructure. Augtera’s Network AI platform can detect abnormal changes in learned patterns to alert on grey failures.
Moreover, by correlating these anomalies with a topology model that includes knowledge of data paths, tunnels and underlay circuits, Augtera can isolate underlay failures from overlay issues.
Figure 1 demonstrates the unmanageable noise see in the raw device telemetry. Each rectangle of the heatmap represents the average latency between an SD-WAN edge pair, for a specific underlay circuit and QoS queue. There really is no proactive operational workflow that’s possible using just the raw telemetry from the SD-WAN infrastructure.

The Figure 2 is Augtera’s representation of the same data, easily consumable in dashboards, or automated workflows with real time notifications. Augtera’s heatmap completely removes the noise from the original data, making it easy to pinpoint which tunnel experienced a network latency grey failure.
The horizontal and vertical patterns tell us there’s an issue with a specific underlay circuit. We can see in this example that the Paris edge device had a short-term latency issue on its internet circuit toward all destinations. Similarly, the New-York edge has some very high latency grey failures, seen on the Internet circuit for both NY devices, toward some specific remote edges.

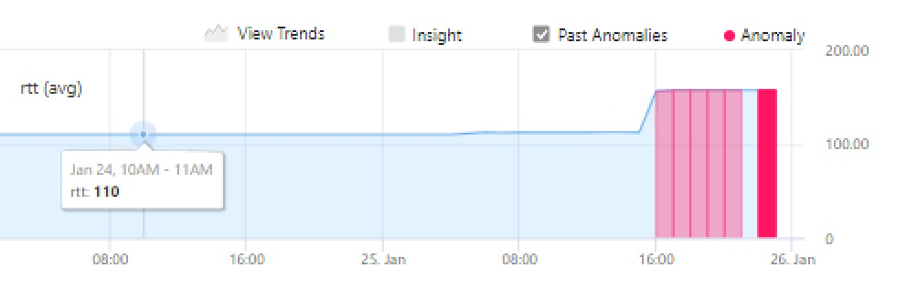
Notice that each anomaly showing up in the above heatmap is the result of an automatic machine learning process that detects abnormal change in its related time series graph. Figure 3 shows an example of such anomaly that the SD-WAN admin can quickly browse to get precise observability of the operational situation.
To have a 30 minute discussion with an engineer on how Augtera Network AI can help with your network challenges please click the contact us link and someone will contact you. Thanks for reading our blog.