Introduction
Compared to threshold-based anomaly detection, machine learning anomaly detection reduces noise and enables proactive action. A single, static, threshold is difficult to maintain and often nonoptimal from the start. Machine learning, by contrast, learns what is normal for each measured metric, and when optimally honed, only generates operationally relevant alarms.
Challenge with Thresholds
The primary challenge with thresholds for anomaly detection is that operators are continually reacting to failures (i.e., the threshold has been crossed and there is an emergency) vs. where they would rather be, which is preventing failures in the first place.
Anyone who has spent time managing a network has heard complaints like “why is the network slow today? Did you make a change last night?” or “the website is timing out. What is going on with the network?”. The network is often considered guilty until proven innocent.
We will illustrate the problems with thresholds, compared to machine learning anomaly detection, with a real life example that network operators in the data center encounter fairly often. It starts with application teams complaining that the “network is slow”.
In this example, we assume there is a real network issue and things are not “hard down” but rather in a degraded condition. Where do you look first? This is where threshold based anomaly detection is deficient. It is designed to catch extreme outliers at the expense of creating significant false positives and noise. It is not designed to find operationally relevant high fidelity changes that may or may not be extreme outliers.
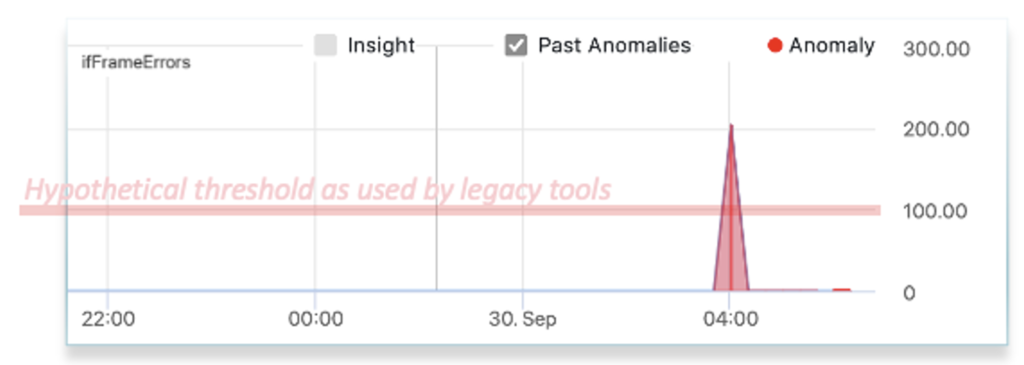
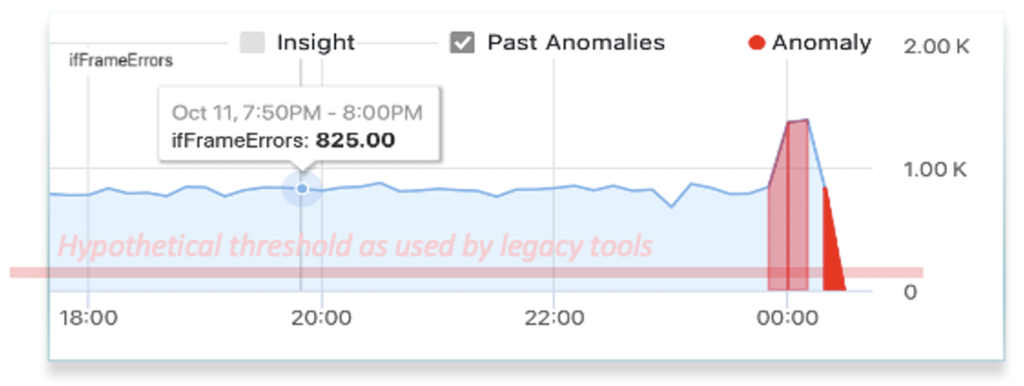
In addition, thresholds are not feasible for many types of metrics as the operator cannot even guess what threshold to apply. In the example below, what is the right threshold to set for interface frame errors? The first appears to produce a good alarm. The 2nd however will never alarm even though there is a storm of errors, and the 3rd will continually alarm creating nothing but noise. The reality is that alerts on this metric will not end up getting used by network operations because thresholds on this metric are too difficult to set across the network and require continual manual tuning. Applying thresholds on the ratio of frame errors to the traffic can help in some cases but suffers from similar challenges.


Now, back to our slow network. The operator would likely start either at the application or user end of the network and trace the path across the network to attempt to identify where there is congestion or drops. Once they find a signal, such as less than the usual traffic, they next need to identify the cause. This will require looking at more data such as control plane metrics, component (e.g. CPU, memory) metrics, or syslog. This process takes considerable time as the operator must review and eliminate each potential cause and may require multiple teams. We refer to this as “finding the needle in the data haystack”
Machine Learning Anomaly Detection Introduction
Machine learning anomaly detection takes a different approach. Augtera’s proprietary ML automatically learns the normal patterns for every interface and device on the network. This includes traffic, discards, errors, optical tx/rx power, queues, CPU, etc. (you get the idea). The ML is also able to identify anomalies related to changes in route tables, flows, retransmits and even syslog patterns. This deep understanding of the network gives operators advance insight when the network begins to misbehave, not when it has reached a critical level. It also gives operators visibility to everything of operational relevance that has changed.
Machine Learning Anomaly Detection Example
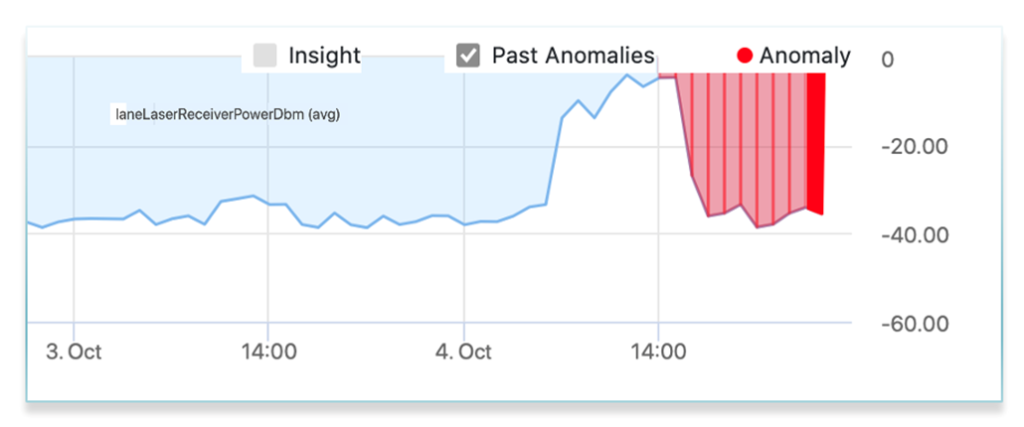
Going back to our example of the network slowdown our users reported. In our hypothetical scenario it was caused by a damaged fiber cable. A technician recently did maintenance in a data center facility and inadvertently caused an optical impairment which pushed the receive power just outside the spec causing laser clipping, which manifested in interface frame errors and slightly less traffic on the impacted interfaces. This again, is a very difficult thing for threshold based monitoring, as laser receive power is based on manufacturer specs and not uniform and there is no definitive good or bad value. It also highlights the value of machine learning. ML anomaly detection will learn the normal receive power for each laser and will be able to detect when the pattern begins to change in an operationally relevant manner. This does require purpose built algorithms for optical metrics.If our operator was using these specialized ML algorithms in their network, they could have detected both the optical degradation and interface frame errors soon after the maintenance and well before users returned the next day.

Conclusion
To avoid many false positives, thresholds are often set to catch extreme outliers. This creates another problem, which is false negatives, anomalous conditions that should be given attention. As a result, operations teams do not see emerging problems before they become failures, and therefore, are always being reactive, instead of proactive.
Machine learning anomaly detection is less noisy and enables operations teams to be proactive. Augtera’s machine learning algorithms have been honed to network patterns, detecting gray failures, before they become hard failures, and adapting to the specific patterns of what is being monitored.

