Observability evolution is constant . The end of June Monitorama conference, in Portland Oregon, was a great event to catch up on the “State of the Nation” in monitoring and observability.
A mostly application/services-oriented conference, the problem statement seemed clear enough “Modern app development broke IT operations”. The same could perhaps be said about network operations, with respect to modern network architectures. In either case, the challenge remains how to manage through something that is here to stay.
Observability Challenges
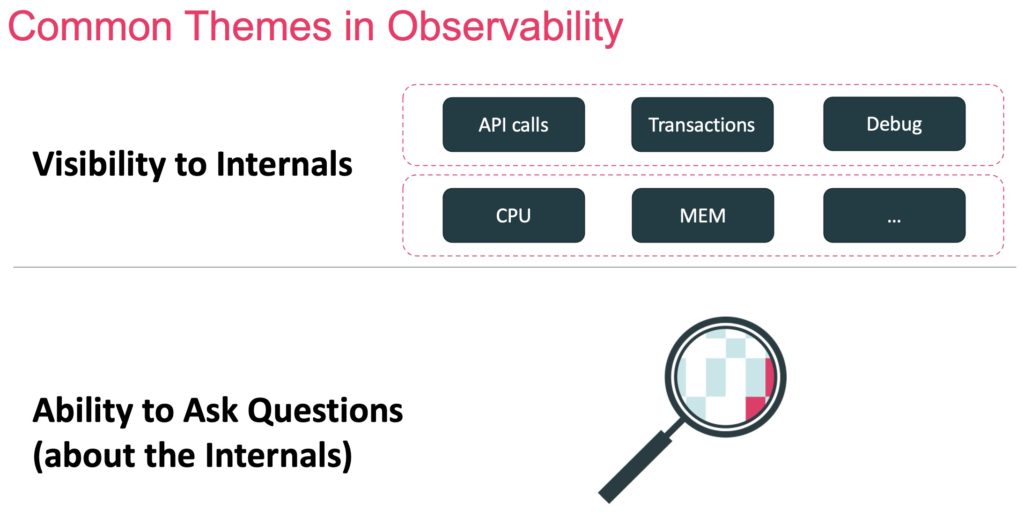
As with many industry terms, definition debate abounds. However, from my perspective, observability is often defined by two characteristics:
- The ability to monitor the hardware and software internals.
- The ability to ask any question about the internals and other data collected.
For applications and networks, data collection has increased dramatically over the last couple of decades. The volume and variety of data as well as the number of things to collect data on. How much data is enough, and how much is too much?
A clear message from speakers and audience at Monitorama was data is expensive, both in financial terms and carbon footprint terms. For usage-based data, example AWS CloudWatch, having multiple tools collect information can amplify cost. WRT carbon footprint, there was a sense there is a growing sensitivity, with stronger regulatory and industry pressures to come.
In the application segment of observability, one of the potential sources of significant data is tracing. Tracing tracks / observes service requests as they pass through multiple microservices / systems. High transaction rates and numerous micro services can lead to a significant additional data.
Tools remain another challenging area: silos, build vs buy, scale, multi-tenancy, ingest peaks / data store lags. In the area of log management and analytics, these challenges led Slack to drive an Open-Source project called KalDB. Like some other solutions in this segment, KalDB is (Apache) Lucerne based.
Observability Recommendations
The recommendations made during the conference were both implicit and explicit.
As an example of an implicit recommendation, there was a fascinating presentation by Meta on what they have done internally to automate noise reduction and ticket creation. Meta estimates that automation detects issues 10x earlier than manual methods, for example operations teams looking at dashboards. In addition, a good chunk of Meta alerts can be auto responded to / remediated.
Other speakers talked about the need to create structured logs that more easily supported querying and indexing. Still others asserted that tracing is not always needed, and that many of the same outcomes can be achieved using logs and metrics.
There was certainly a sensibility to carbon footprint issues at Monitorama and implied recommendation that measuring this is something that should be on everyone’s mind.
Augtera Networks Approach
The Augtera Networks platform provides monitoring, observability, AIOps, and automation. We realize that not every operations team is in the same place when it comes to preferences for each of those approaches.
We recognize there are many drivers for efficient and scalable execution, so we optimize both our runtime code choices and algorithms to be as efficient as possible, and we believe much more efficient than other vendors.
Log processing is challenging. We do believe our use of real-time natural language processing significantly reduces some of the log analytics issues other approaches have experienced. Specifically, we can analyze log messages, regardless of the order in which information appears through our semantic understanding.
Conclusion
Every year brings new challenges and new solutions. Both application and network architectures have dramatically changed over the last decade, and legacy approaches are struggling to produce good outcomes for operations teams. Monitoring, especially metric monitoring provides visualizations that provide a certain level of understanding. Observability provides further understanding through the monitoring or internals and the ability to ask questions across multiple data sources. However, both monitoring and observability still entail some manual effort with respect to anomaly detection and mitigation/remediation responses. Approaches like multilayer topology aware correlation, machine learning models for detection, and customer-driven policy provide the foundation for automation.
Monitorama 2022 was a great conference and an excellent opportunity to hear from SREs, Vendors, and others on the state of monitoring, observability, and more.