NetAppOps is needed today because the Network Operations mission is never stagnant, changing over time as expectations change, and the overall IT mission evolves.
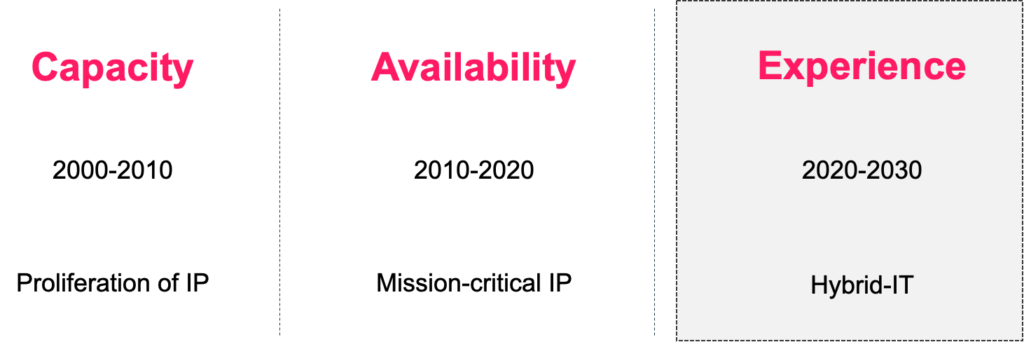
Three Phases of Network Operations Evolution for IP Networks
While the Internet boom occurred in the 90’s with dial-up, ISDN, some DSL & Cable deployments, the big end-to-end deployment phase of IP connectivity and capacity was in the 2000s. IP was deployed pervasively in the core, edge, and aggregation networks. In the following decade, the Network Operations mission was focused on ensuring the availability and robustness of IP networks in support of growing dependence for commerce, social media, streaming media, public sector, and more.
Expectations are changing again. Connectivity and capacity are not sufficient. Availability is not sufficient. In an era of Hybrid IT, SaaS, and Multi-Cloud, the application experience is critical. Network Operations teams need tools designed for their mission, that determine if the network is or is not impacting application experience, and where enable, automate responses.
NetAppOps
Network Operations teams need to
Identify and mitigate application experience impacting network anomalies before customer / application teams create trouble tickets.
Quickly determine when the network is not impacting application experience.
Observability and AIOps tools built for compute infrastructure and application teams do not have the ability to do this. They do not understand network data sources relevant to these issues, and they do not understand network topology, constructs, and relationships in deep enough way to understand the consequences of network conditions.
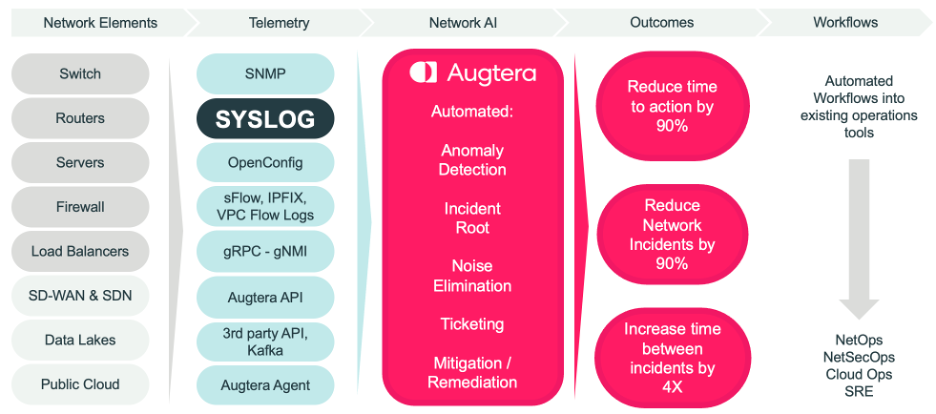
NetAppOps Tools
There are many significant differences between tools for Application teams and tools for Network Operations teams:
Application tools focus on MELT (Metrics, Events, Logs, and Traces)
Network tools focus on CAMEL (Configuration, Alarms, Metrics, Events, Logs)
Network tools have a deep understanding of TCP flow data (sFlow, IPFIX, VPC Flow Logs)
Network tools have a deep understanding of network constructs and relationships
Only Network Operations tools can connect the dots across Network Operations data (SNMP, Syslog, sFlow, etc), multi-layer topology, network constructs, and network relationships.
To schedule a meeting with an Augtera Networks engineer to learn how Network AI is enabling Network Operations teams to determine when the network is or is not impacting application experience, click on this link.
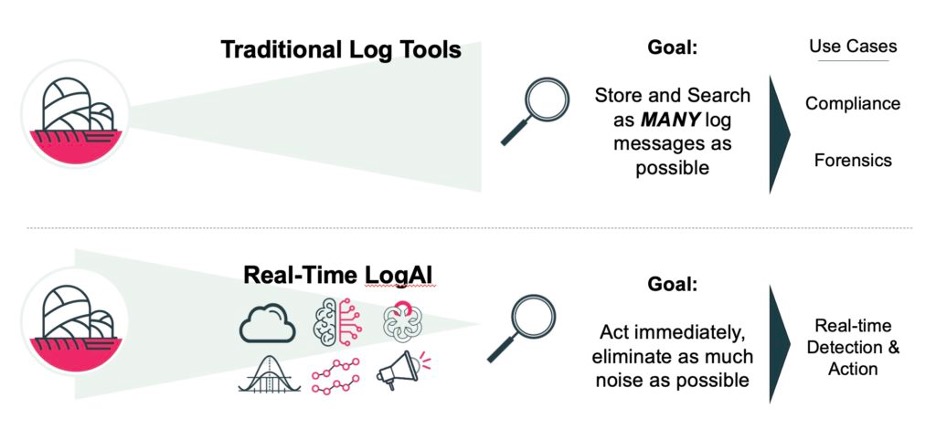
LogAI was developed to address Network Operations uses cases. To process in real-time, streaming log data, from any log, without latency or message drops. Specifically, to address the challenges of producing actionable insights from unstructured text data at such high volumes, where noise levels are so high, and the unknown unknowns are prevalent and undetected.
Most log tools collect, store, and search /query as many log messages, from as many sources, as possible. This historical record of log messages is good for compliance, and historical searches for incident context and/or root cause. However, these tools are not what is needed by operations teams to detect and take real-time action on existing and emerging incidents.
LogAI changes the log experience through high-performance, high-efficiency real-time AI/ML processing of streaming log messages from Syslog, or other non-standard format Logs such as Cloud Logs encoded as JSON and ingested using Kafka or Augtera APIs. The result is actionable and automated AI “needles” from the Log data haystack.
Network operations teams today either have no ability to process Logs in real-time or can only create limited rules to identify a set of known Logsignatures. This leaves several gaps:
Anomaly symptoms that have never been seen before i.e., the unknown unknowns
Anomalies that are never acted on because they are lost in the noise
Immediate implementation of new known Log signatures due to cumbersome rules-based approaches and/or lag time for internal software development and/or other inter-organization / process issues
Extraction of metrics for anomaly detection & visualization
Message rate-based anomaly detection with high fidelity and low noise
Elimination of noise prior to signaling consoles, trouble ticket systems, and automation systems
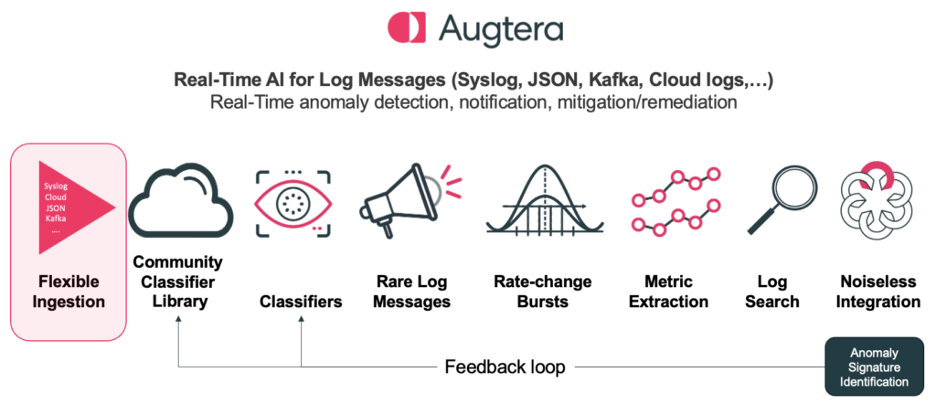
Augtera Networks LogAI is a vastly different approach.
LogAI has flexible Ingestion
Syslog has long been the standard of network equipment vendors, however with the rise of cloud-based systems and message streaming technologies new logs formats, such as encoding logs in JSON are becoming more common. However, logs are generated by Cloud based systems as well as equipment vendors in many other non-standard formats, typically encoded as JSON. Further logs are collected, normalized, and distributed by operations teams in many other formats, typically also encoded as JSON. Kafka is an emerging message bus for many types of data within Network Operations environments.
LogAI supports all these scenarios today and at its core is agnostic to the format of the log messages when they are ingested, as all logs are normalized to a common internal format.
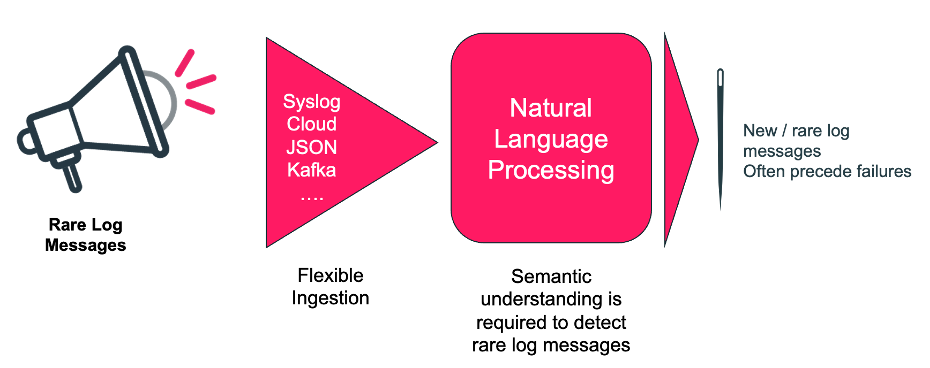
LogAI Lets You See the Unknown Unknowns
Log messages across the industry are increasing in volume, velocity, and variety. No two equipment vendors generate the same log messagesand log messages change and evolve even within the same equipment vendor, over time. When the symptoms of emerging incidents arise, they are easily missed. In addition, many persistent issues remain, lost in the noise.
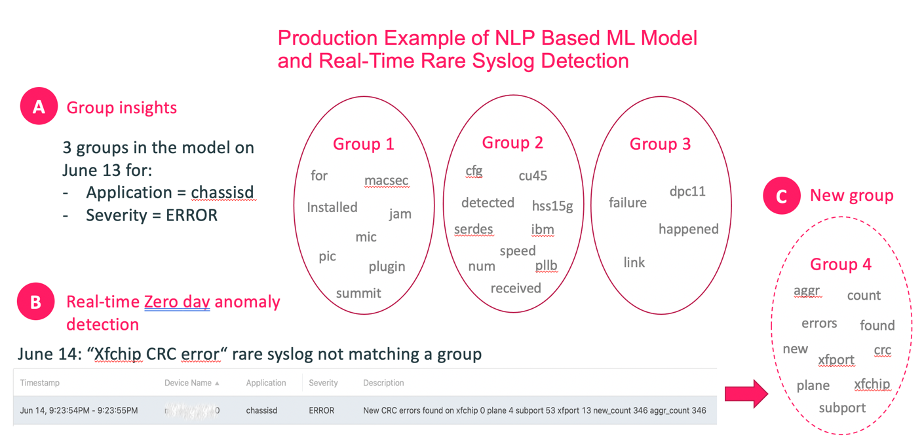
Zero Day Anomalies is a Natural Language Processing (NLP) based capability that detects new, rare, and unique log messages the first time they appear. So, if they are the symptom of a current or future incident, action can be taken immediately. The capability focuses on rare messages that have not been seen within a customer-defined period.
Determining what is a new or rare log message is not trivial though. There are so many nuances in log messages that simple text processing will lead to false results. To realize this capability, LogAI uses a high-performance, high-efficiency Natural Language Processing implementation, purpose-built by Augtera Networks. This is needed because semantic understanding is necessary to determine what is a new or rare log message.
This industry-first capability is the result of purpose-built Natural Language Processing (NLP) technology, illustrated in the image above. For more details request that an Augtera Networks engineer contact you.
LogAI Lets You See a Larger Spectrum of Known Knowns
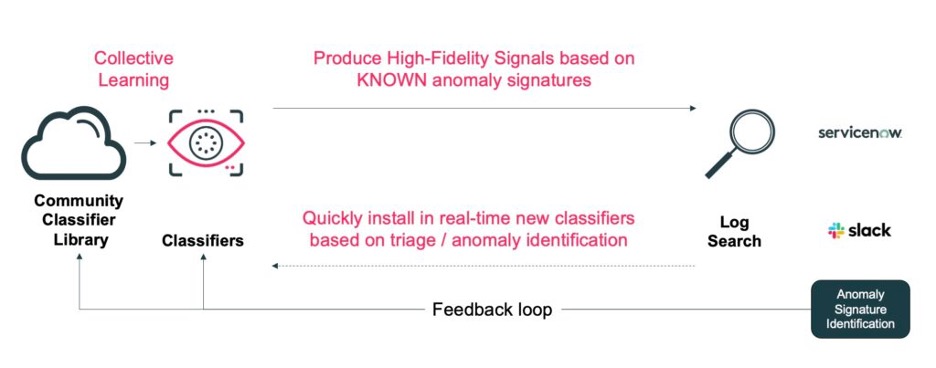
There will always be a place for high-performance detection of known Log signatures that are operationally relevant or symptoms of incidents. LogAI “classifiers” are for this purpose. LogAI classifiers are regex-based rules that can be applied at run-time on streaming Logs at scale. However, the number of classifiers each individual network operations team can determine and create is smaller than what a whole community can. Augtera provides collective learning and classifiers from the entire customer base. The full collection of classifiers is made available to everyone in the customer base. This accelerates the detection of “known knowns” for all Augtera customers.
In response to the detection of log signatures through “classifiers”, the customer can specify numerous actions, including:
Sending the message to the Network AI/ML pipeline
Formatting some aspect of the log message – for example, changing the severity, adding meta data, adding IP information
Publishing the message to a Kafka topic
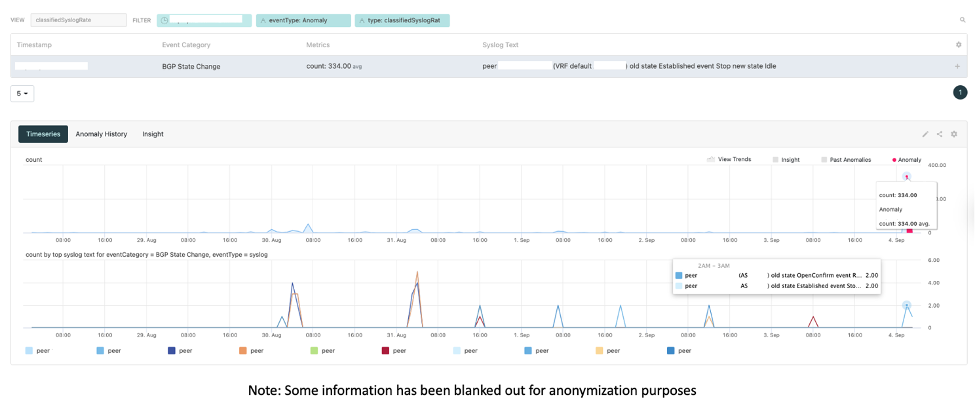
LogAI Lets You See Log Message Rate Changes
A meaningful up or down shift in the rate of even a known log message is often the symptom of a problem. However, algorithms designed to simply track any abnormal rate are noisy. Augtera Networks developed a purpose-built algorithm for identifying meaningful bursts in messages.
In the graphic above, BGP state changes are detected. Normally, generating an alarm for every BGP state change would be noisy. Here though, Augtera Network AI detects a significant change in rate, indicating a BGP issue in the network.
Metric Extraction from Logs
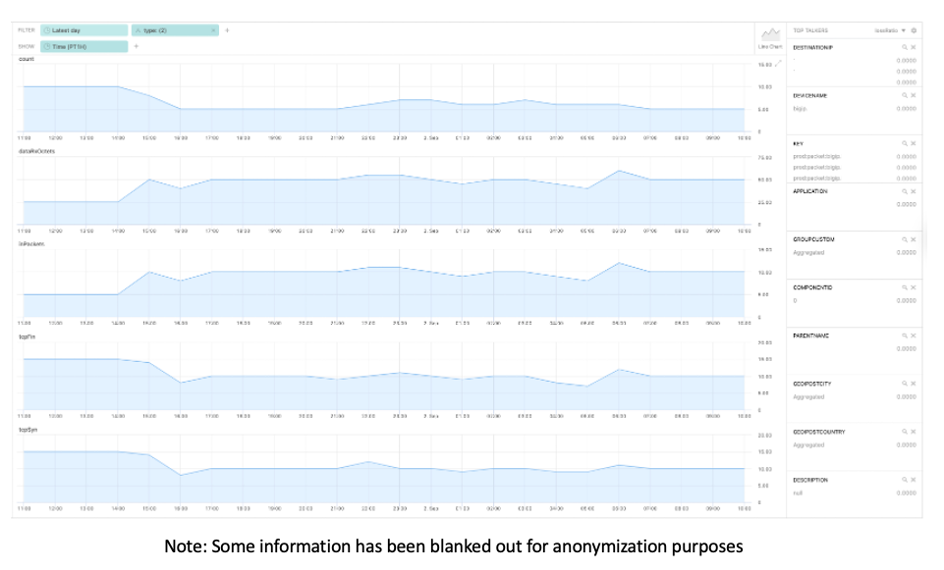
Log messages often contain metrics. However, embedded in an unstructured log message, these metrics are hard to extract, analyze and visualize with network operations tools.
Augtera Networks enables the extraction of metrics from log messages. Metrics can then be used by the rest of the Augtera Network AI platform for anomaly detection, gray failure detection, incident root identification, and notification (collaboration, trouble ticketing, automation systems,…). Metric extraction can be used for any log message, regardless of where in the network the message pertains to. The extraction process is not specific to a set of messages.
The above graphic is an example of metric extraction and the resultant visualization. On this occasion, metrics have been extracted from syslog messages like the below:
Whether metric extraction is used or not, log messages can be correlated with other data types / sources. To Augtera’s Network AI multi-layer, topology-aware correlation technology, log messages are just another data source, normalized, and used for actionable insights like any other data.
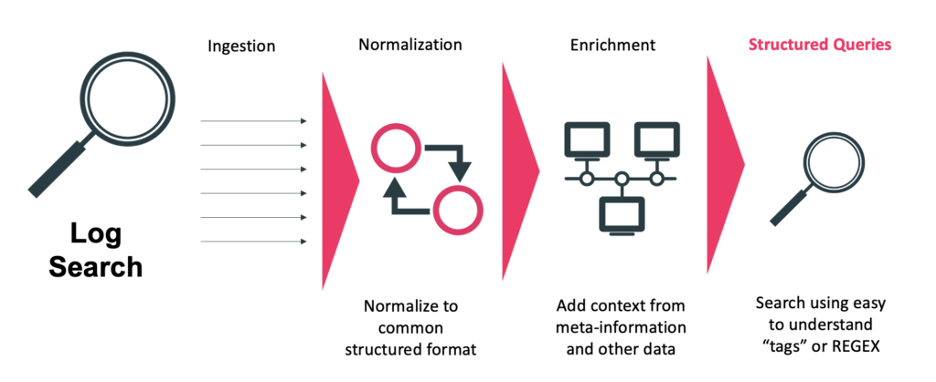
LogAI Search
LogAI is like typical log tools that are designed as a historical search capability for the many exabytes of data stored. However, for the customer-defined period data is stored, LogAI search has some compelling capabilities.
After automated normalization and enrichment, structured search can be used, including searching by tags. Traditional regex searches can also be done.
Conclusion
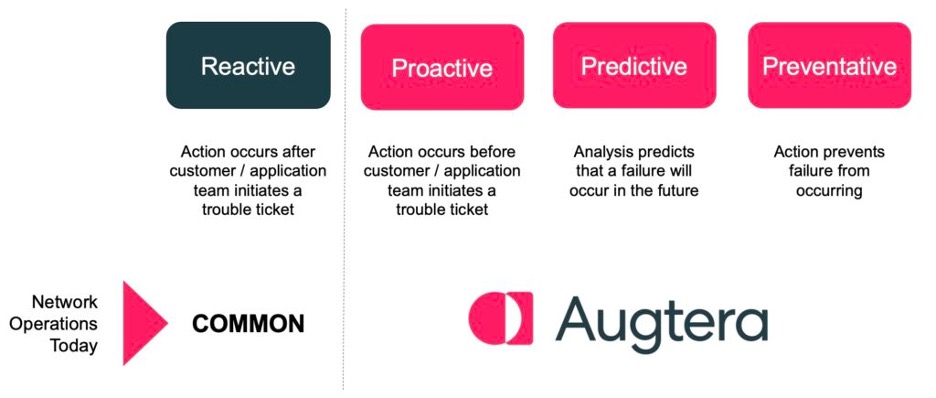
Logs contain a wealth of information that operators increasingly want integrated into real-time workflows. In addition, Network Operations teams can no longer be simply reactive to incidents, they must proactively detect, see potential incidents before they occur, and prevent those incidents from ever happening.
The Augtera Network AI platform, including LogAI, was developed to not only enable network operations teams to react faster, but to reduce the need to react by eliminating noise and preventing future incidents.
To request more information on LogAI or to request a demonstration:
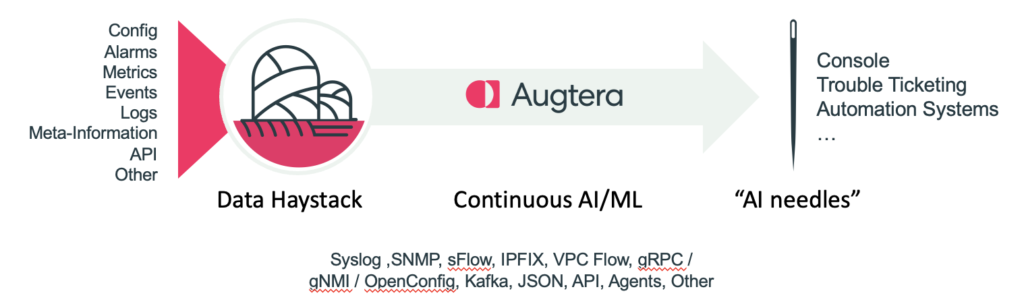
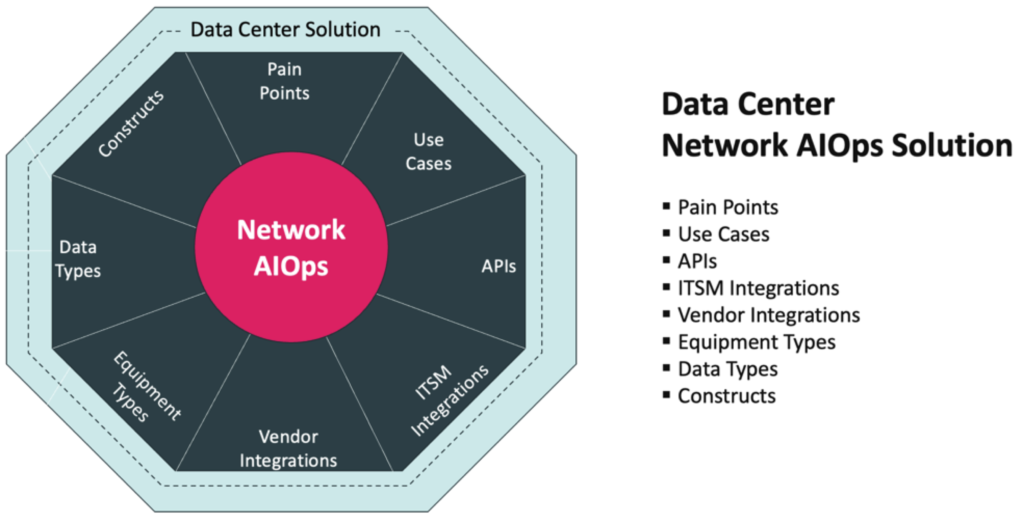
The foundation of the Data Center Solution is the Network AI platform which ingests a large scope of data types with high-performance, scale, and efficiency prior to automating anomaly detection, noise elimination, incident root identification, trouble ticket creation and notification.
In addition to the many platform advantages, Augtera Networks has spent several years, working closely with Data Center clients to address a range of pain points, constructs, equipment types and more.
The result is the industry’s leading Data Center Network Operations Tool.
Purpose Built for the Data Center
The Data Center Network AIOps solution results from three years of close development with network operations teams overseeing some of the largest data center networks. Based on Augtera’s Network AIOps platform, the solution addresses key Data Center pain points and use cases, in addition to supporting required APIs, ITSM integrations, vendor integrations, equipment types, data types and constructs. For more information on these aspects of the solution, see Augtera Networks Data Center Solution Brief.
Data center network and service architectures have changed dramatically over the last decade resulting in the emergence of new complexities that cannot be managed with old solutions. The Augtera platform transforms manual, reactive, and noisy to automated, proactive, and relevant for the following domains:
Applications
Hybrid Cloud
Underlays and Overlays
Switches & routers
Firewalls and Load Balancers
Augtera’s platform is production proven at scale, with customers realizing the following benefits:
90%+ reduction in Mean Time to Detect (MTTD)
50%+ reduction in Mean Time to Mitigation (MTTM)
40%+ reduction in Mean Time to Repair (MTTR)
4x+ improvement of Mean Time Between Incidents
Anomalies never seen before are now visible, noise is eliminated, mitigation is occurring rapidly, there are less incidents that need to be ticketed, and more time between incidents. Data center operations is being transformed from manual, reactive, and noisy to automated, proactive, and relevant.
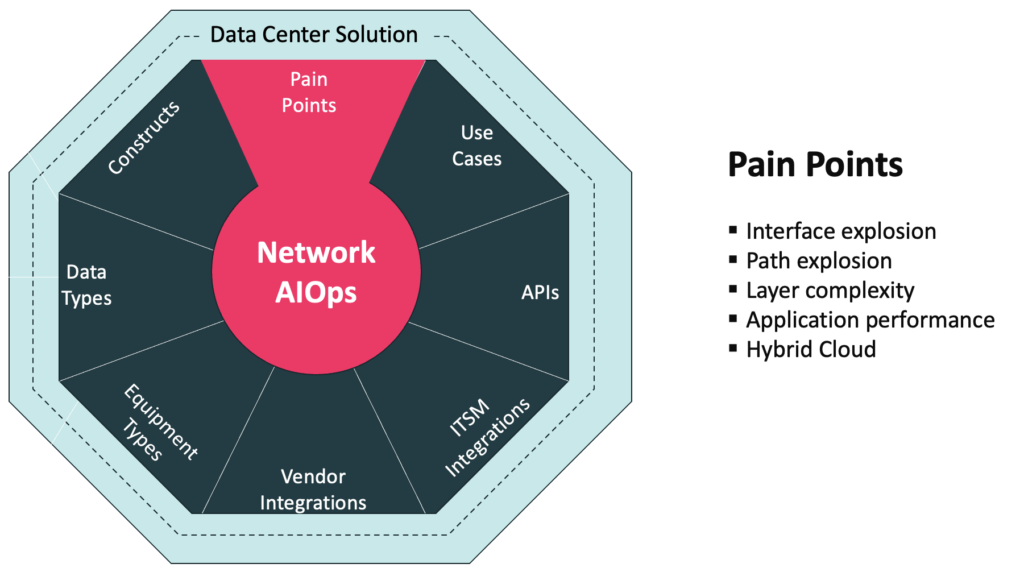
Data Center Challenges
Modern data center architectures comprise Layer 3 Clos fabrics, often built using BGP. This provides equal cost multipath (ECMP) between top-of-rack (ToR) switches that can utilize all links for east-west traffic between any two switches. This is highly beneficial for scale, resiliency and optimal bandwidth utilization. At the same time it creates operational challenges that stem from “lots of links”.
The Landscape and challenges described here are not limited to hyper scale data centers. Data centers of all sizes have similar challenges.
Application uptime and performance is becoming even more critical to business.
Increasing failure points across control and data plane
Heterogeneous Environments
Hard to detect failures are common
Legacy tools and processes are manual, reactive, and noisy
Driven by SaaS, Hybrid Cloud, digital transformation, and other trends, application uptime and performance are becoming even more critical to business. Networking teams are accountable to the business. Operation teams need to plan for business and application continuity.
There are multiple drivers for increasing failure points including dense multipath architectures that create operational challenges from “Lots of Links”, cloud Interconnects from the data center to the cloud, and virtual networks in the public cloud.
Heterogeneous Environments
Multi-vendor implementations
Increasing use of disaggregation & white labeled hardware
Hard to detect failures are common
Transient control plane and hardware failures
Grey failures / brownouts
Long-lived failures
Legacy tools and processes are manual, reactive, and noisy
Significant time to detect, mitigate, and repair operational issues.
Application owners complain of problems before operations teams’ act
Foundation Capabilities
There are several capabilities that are foundational / common to the data center solution, independent of the domain (underlay, overlay, hybrid cloud,…), including:
Noise elimination
Automated notifications and ticketing
Autocorrelation
Proactively detecting gray failures
https://www.youtube.com/embed/pqtDyWiDdu4?feature=oembedAugtera Founder and CEO, Rahul Aggarwal, Tech Field Day / Networking Field Day 28, May, 2022
Noise Elimination
The Augtera platform takes a holistic approach to eliminating noise. Noise elimination is not the result of one technology or one approach. It is the result of understanding noise throughout the entire pipeline from ingestion to ticketing.
There are two major categories of noise elimination capabilities:
Selecting the strongest signals from a sea of noise
Policy-driven reduction of analysis and notification
Machine learning anomalies and insights detected by Augtera are automatically notified to Slack, Syslog, Kafka or ticketed to Service Now.
High fidelity proactive alerts & tickets that help transform operations to proactive from reactive
De-duplication aware to suppress duplicates while notifying
Duplicates are added as events against existing ticket state in Service Now
Auto-correlated events are added as events against the same Service Now ticket
Ticket life cycle aware
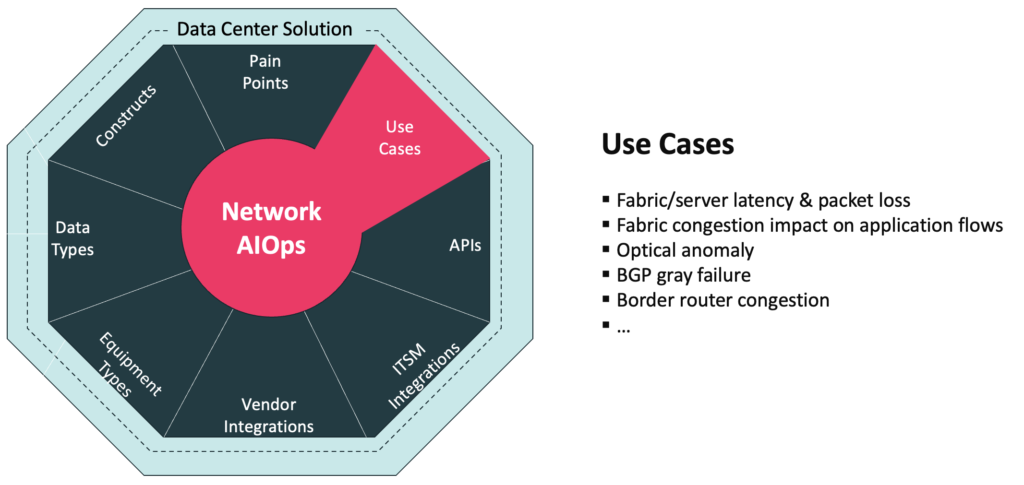
Data Center Use Cases & Auto-Mitigation / Remediation
Over three years of development, many Data Center Network Operations use cases have been addressed.
A couple of examples include:
Fabric/server latency & packet loss
Fabric congestion impact on application flows
Fabric / Server, Hybrid Cloud Latency & Packet Loss
In the Data Center, the network does not end at ToR (Top of Rack) switches, it extends all the way to servers. Detecting changes in latency and packet loss within the fabric, and all the way to servers is critical today. However, while other solutions stop at measurements, the Augtera Data Center Solution inputs the measurements, into Machine Learning (ML) based anomaly detection to find operationally relevant anomalies in latency and loss. The solution further inputs these anomalies along with other data sources, and performs multi-layer, topology- aware auto-correlation. The Augtera Data Center Solution uses Machine Learning (ML) models instead of static thresholds to reduce anomaly detection noise. Less noise, better insights. Augtera Networks latency and packet loss anomaly detection is also supported for Hybrid / Multi-Cloud.
Fabric Congestion Impact on Application Flows
It is one thing to know or suspect there is fabric congestion, it is another to know if that congestion is impacting applications. The Augtera Data Center Solution can determine if specific applications are experiencing performance degradation. It is critical today that network operations teams be able provide answers to application teams on the impact or innocence of the network with respect to Data Center / Cloud-based applications.
Auto-mitigation / remediation
Augtera Networks has worked with customers on a growing number of auto-mitigation / auto-remediation including:
Optical anomaly
BGP gray failure
Border router congestion
Data Center Autocorrelation
Multi-layer topology aware autocorrelation automatically correlates operationally relevant events and Augtera generated anomalies across the BGP and layer 2 control plane, IP and VXLAN data plane, synthetic probe anomalies, system and environmental degradation anomalies and other grey failures. The output of autocorrelation is “Augtera Incidents”.
This has several benefits:
Reduction of 25-75% in the number of incidents / tickets that NOC needs to manage
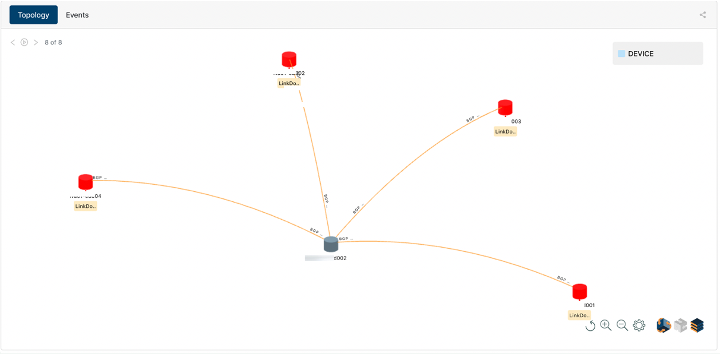
High fidelity context for root cause analysis, mitigation, and remediation. For example, Figure X shows an Augtera incident that auto-correlates 8 link and BGP flaps on 4 switches and identifies the mis-behaving switch that they are all connected to, even when the misbehaving switch does not generate any alerts.
Proactively Detect Grey Failures
Grey failures or brown outs refer to problems that are brewing and will eventually cause an outage. However, their effect is not immediately obvious. Applications may notice them and complain but they can be difficult to detect, trouble shoot and root cause. For example, intermittent packet drops can be the result of hardware issues, fiber issues, optical problems, or software issues.
Augtera anomaly detection algorithms on hundreds of metrics can detect significant pattern changes and detect control plane, data plane or hardware grey failures hours or days before the current reactive approaches.
Zero-day syslog anomalies can find the very first occurrence of an important syslog that indicates a grey failure. e.g., ASIC parity error.
Data Center Switching Fabric and Servers
Proactive Detection of Latency, Loss and Microbursts
Augtera agent can be deployed on hosts, leaf’s, and spines and enabled for synthetic probes
Probes continually measure loss and latency to each other
Augtera automatically learns normal loss/latency patterns between pair of devices and generates an anomaly when there is a degradation without thresholds or any other configuration
Anomalies can be overlayed on topology or viewed in heatmaps.
Augtera leverages peak buffer depth metrics from telemetry streaming, automatically learns the normal pattern for every queue and generates anomalies that detect microbursts
Proactively Detect Environmental and Optical Degradation
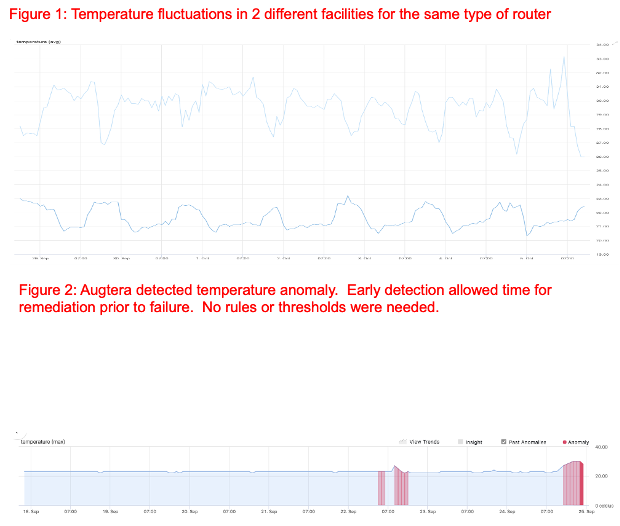
Early detection of temperature, fan speed, power, voltage and optical degradation via ML Anomaly Detection.
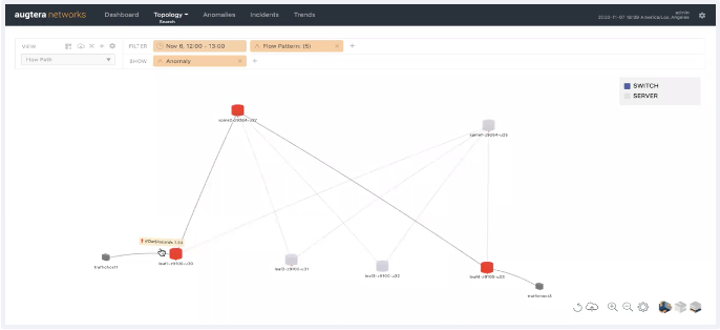
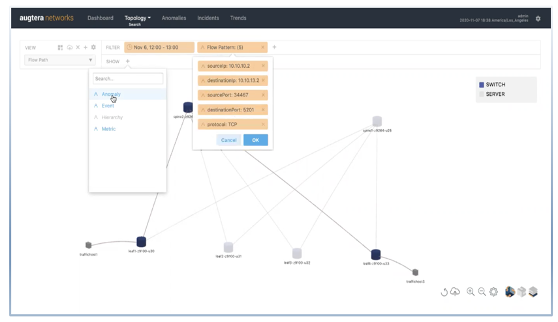
Traffic and Flow Mapping and Anomalies
Operators can map the path taken by a flow as well as the anomalies along the path in real-time or at a specific time interval in the past to determine the root cause of application issues
Anomaly detection on traffic utilization as an aggregate across a POD, fabric or data center interconnects to proactively detect unexpected major changes in traffic
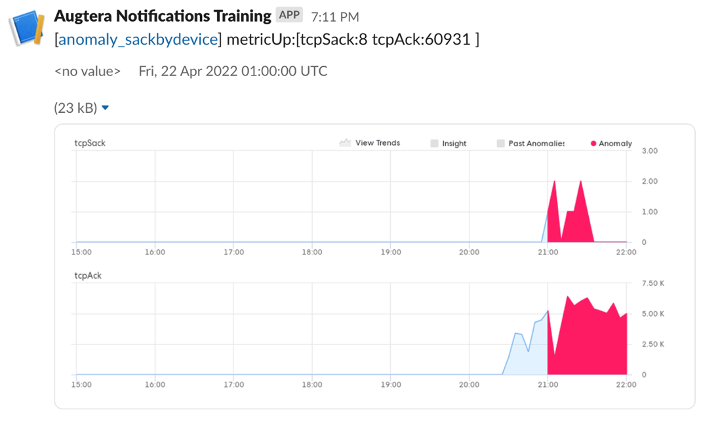
Anomaly detection on TCP flags to detect SYN floods, unstable TCP sessions, etc.
Ad-hoc analytics to detect ECMP polarization on specific switches
Application Performance and Availability
Enables a customer to proactively determine increase in latency or loss across the data center fabric due to packet drops in the fabric and further determine the application flows responsible for the congestion.
https://www.youtube.com/embed/GV6KBCnZgLU?feature=oembedActionable Insights for Data Center, SE Director, John Heintz, Networking Field Day 28, May 2022
Augtera agents need to be installed on either the fabric leaf switches or servers. The solution encompasses:
Anomaly detection on probe latency and loss between agents
Anomaly detection on packet drops on fabric interfaces
Auto-correlation of probe anomalies and interface anomalies
Auto-notification / ticketing of Augtera incidents that contain both Probe and interface anomalies and detect Fabric Congestion
sFlow enablement on all leaf switches (for a 2 stage Clos) or spine switches with the Augtera stack configured as the sFlow collector
The above results in proactive notifications of increase in latency / loss across the fabric correlated with packet drops in the fabric. sFlow analysis enables an operator to find the flows transiting the interface on which packets are dropped at the time of the drops.
TCP Retransmit Anomalies and Impacted Flows
Augtera collects sFlow telemetry from the fabric. Augtera ML is configured to model the volume of TCP retransmits on a switch or interface and identifies when there is an operationally relevant pattern change. Operator can then use Augtera analytics to identify the impacted flows. Augtera can also automatically identify if there are fabric interfaces that are responsible for the retransmissions or prove that the network is innocent.
Firewall and Load Balancer Anomalies and Observability
Augtera integrates with a wide range of firewall and load balancer vendors and ingests metric, log and flow data.
Augtera can automatically detect a spike in rejected flows as well as identify the specific flows
Zero Day syslog anomalies can detect the first occurrence of rare syslog messages that identify firewall or load balancer issues
Traffic and flow anomalies described above are applicable to firewall and load balancer infrastructure
Hybrid Cloud
Hybrid Cloud Traffic, Flow, Latency and Loss Anomalies
Several of the solutions described above are applicable to Hybrid Cloud:
Aggregate traffic anomalies on data center to public cloud interconnects
Flow observability, analytics and anomalies based on sFlow and IPFIX streamed from data center border routers or from VPC flow logs in the public cloud
Deployment of Augtera agents on public cloud VMs and data center servers and switches to detect hybrid cloud loss and latency degradation
Integration with server and VM metrics and logs in the data center as well as with public cloud VM metrics and logs
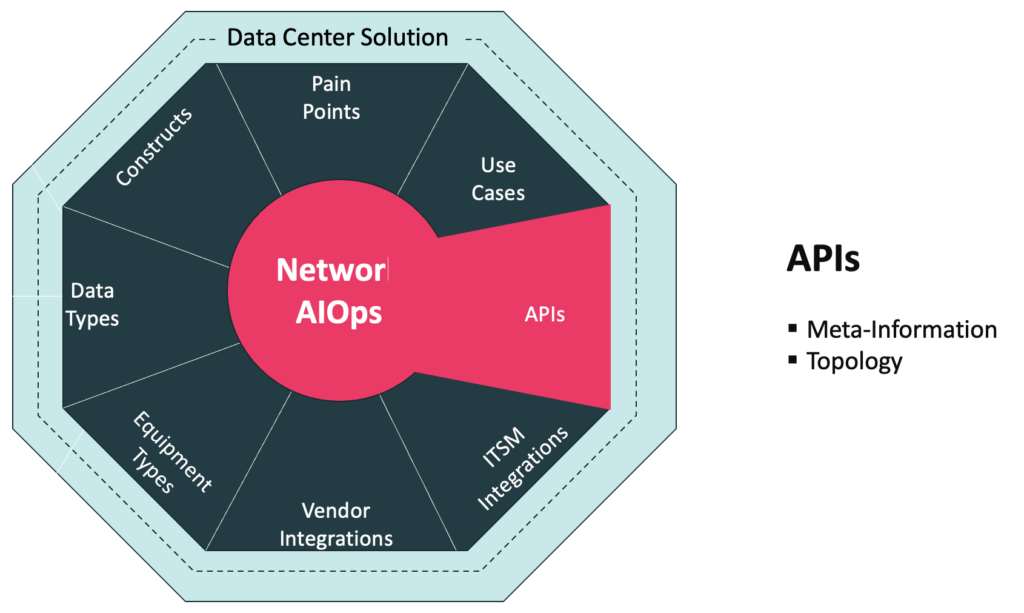
NetOps / DevOps Friendly APIs
There are numerous short and long-term drivers for APIs. In the short-term, an operations team may not be able to provide direct access to a data source for a Network Operations tool. Sometimes the export of data to a file is explored, and maybe the only option. However, this is far from optimal. It is not dynamic for one. In these cases, Augtera provides its own APIs and support for other APIs. In the long-term, the transition to NetOps and DevOps-friendly Network Operations is the main driver for supporting and providing APIs.
Augtera Networks is always exploring with customers what APIs to support and what APIs to provide for the Data Center Solution. Two APIs that have been powerful in Data Center Solutions are:
Meta-Information API
Topology API
There are many powerful uses of Meta-Information, including data / alert enrichment. Of particular concern to Network Operations teams is communicating to Network Operations tools when to suppress alarms. For example, a Network Operations team may know that it is performing maintenance, so it does not need alarms for impacted elements.
Augtera believes strongly that auto-correlation needs to be topology-aware to effectively identify the root of an incident, which is why topology auto-discovery is provided in the base platform. However, there are times that Network Operations teams cannot provide use of the protocols needed to do auto-discovery. For these occasions, using an API is a good alternative.
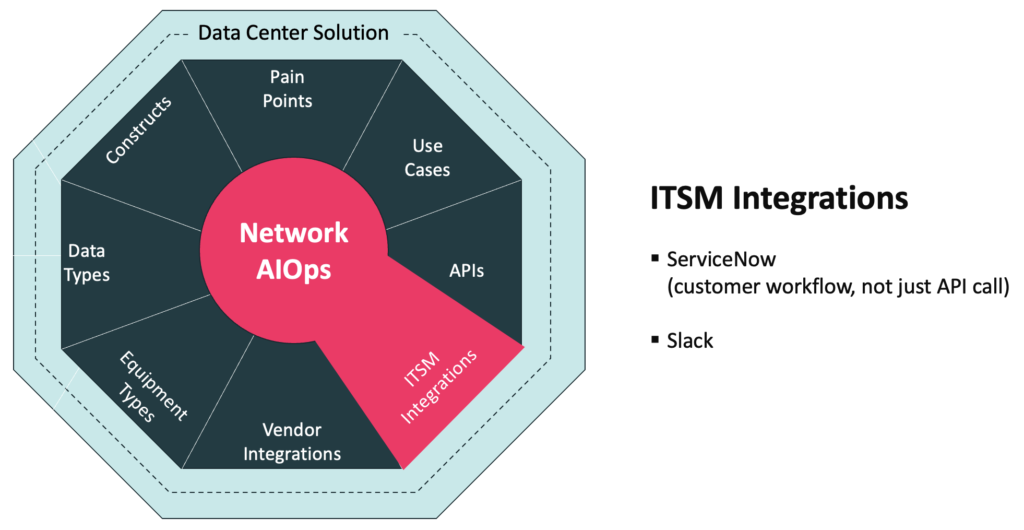
ITSM Integrations
All Network Operations teams have a “job to be done”, and that job cannot be done unless tools are integrated into / aware-of processes and workflows. Any tool vendor can say they support an API. The “rubber meets the road” on the question of whether a tool is enabling the network operations team to get their job done.
There are numerous ways in which Augtera has worked with Data Center Network Operations teams to support workflows and processes.
ServiceNow tickets are often the trigger for scheduling skilled engineers to act on an incident. As skilled engineers are a scarce resource, it is critical that no noise is injected into ServiceNow. The Augtera Networks Data Center Solution eliminates noise from anomaly detection and ingestion of multiple data sources, suppresses maintenance incidents, de-duplicates, and provides customer policy definition that indicates what is operationally relevant and what is high or low priority.
As Network Operations teams seek to be more collaborative, tools like Slack have been adopted. Augtera Networks provides alerts / visualizations within Slack.
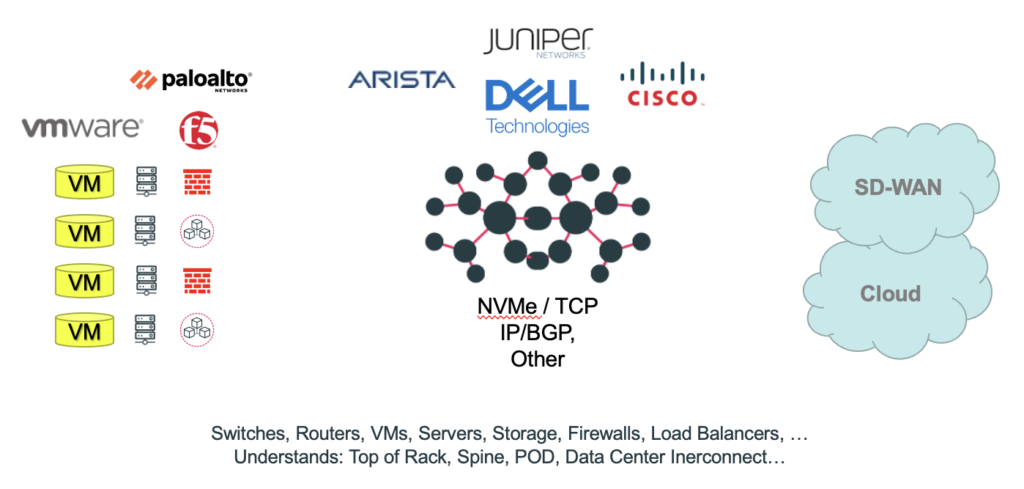
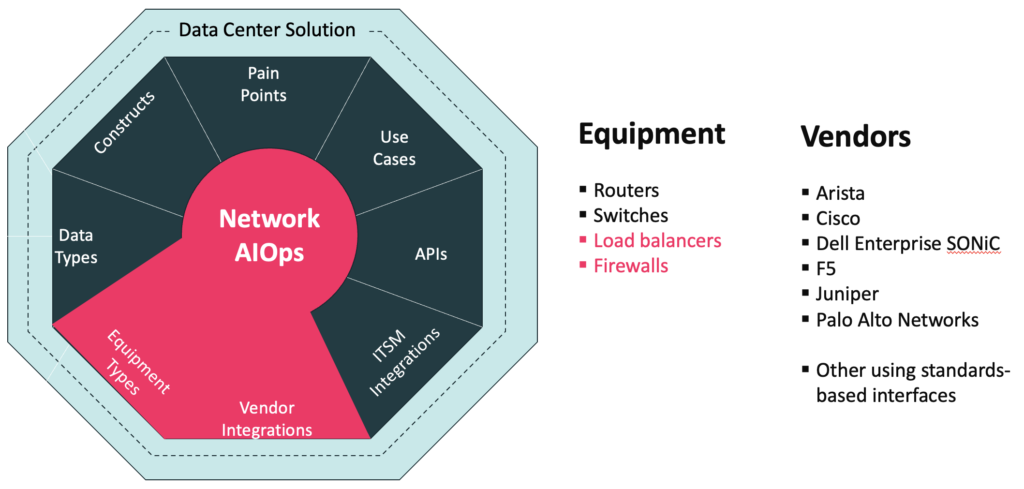
Data Center Relevant Equipment Types and Multi-Vendor
Augtera Networks is inherently differentiated from single-vendor / single-vendor-oriented solutions by broad multi-vendor support. While equipment vendors are often motivated to provide better support for their own equipment, Augtera Networks is motivated to provide robust multi-vendor support.
The Augtera Data Center Solution supports any network object that uses standard interfaces. Some of the vendors / technologies that Augtera has production proven support for data center and hybrid cloud operations include:
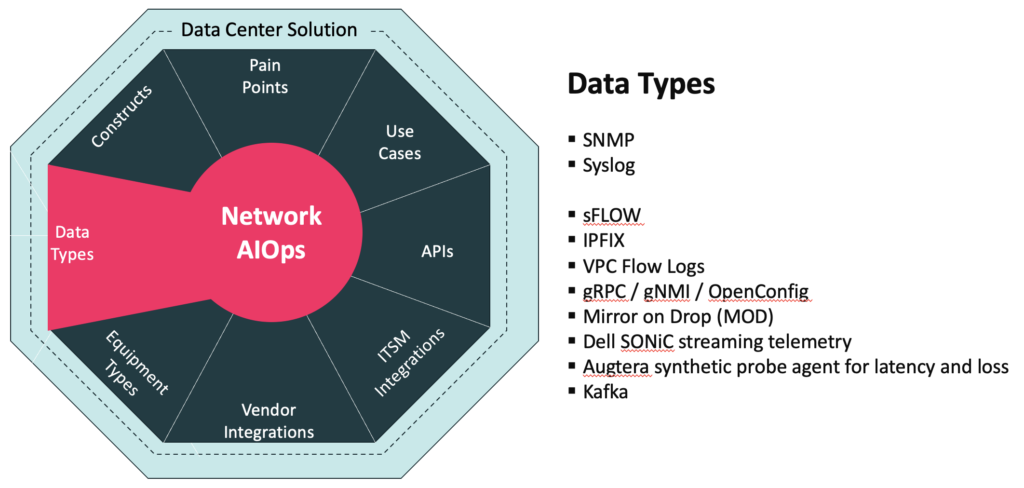
Data Center Data Types
Network AIOps begins with ingesting the data needed to develop the insights and actions that transform Network Operations. Any Data Center Solution must support the needed data.
Augtera Networks has found SNMP and Syslog is fundamental to most solutions. In fact, some solutions can be provided with Syslog only. For the Data Center Solution, sFLOW and IPFIX are important for anomaly detection involving flows and application performance degradation. For some SD-WAN offerings, IPFIX is the only flow data supported.
OpenConfig and gRPC/gNMI are emerging approaches. While implementations are still maturing in many cases, support is critical for some Data Center equipment and customer preferences. VPC Flow Log support extends the Data Center Solution to cloud environments.
Synthetic agents for latency and loss are critical because other telemetry data does not provide this information. Kafka is an increasingly important transport for many data types.
The Augtera Data Center Solution also supports the Mirror on Drop (MOD) Broadcom chip capability enabled on Dell Enterprise SONiC, in addition to Dell Enterprise SONiC streaming telemetry.
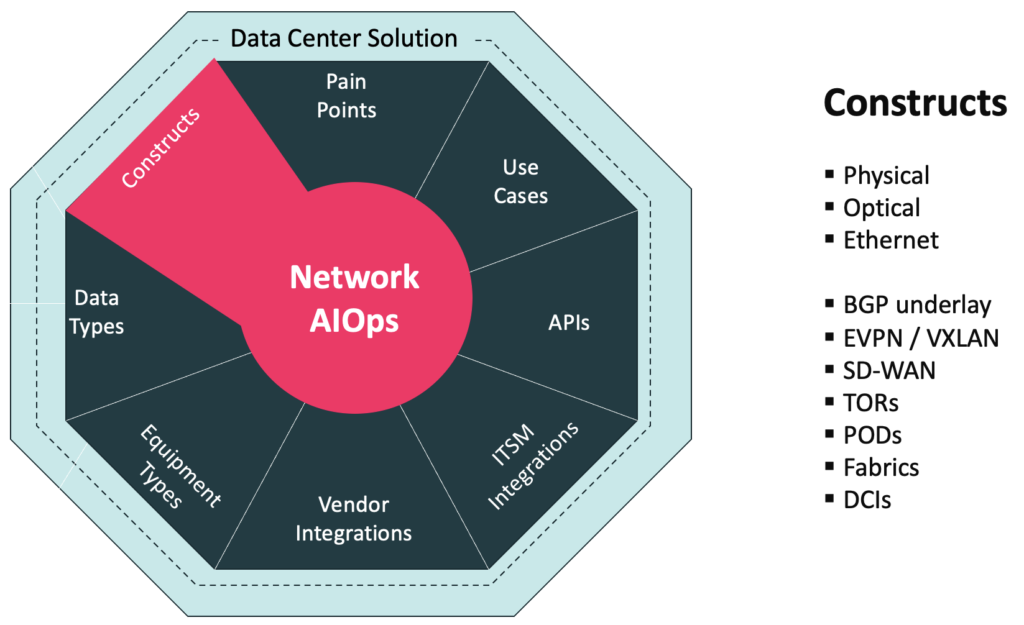
Data Center Constructs
Every networking environment has potentially different constructs that need to be supported, because of network architecture and design considerations inherent to that environment.
For Data Center environments, there are numerous constructs that need to be supported. Some already mentioned in this paper include physical, optical, Ethernet, underlays, overlays, and SD-WAN. The Data Center has other unique constructs like Top of Rack, spine switches, PODs, L3 Clos Fabrics, and Data Center Interconnects (DCIs).
Why does this matter? What if a network operations team decides they want to understand anomalies at the POD aggregate level? Then the POD construct must be supported by the solution. What if a network operations team decides links from a ToR to a server are not high priority from a notification perspective, but ToR uplinks are? Then the ToR construct must be supported and understood.
If the constructs important to data center environments are not understood and integrated into the solution, then important noise reduction, notification, and analysis policies cannot be realized.
VXLAN and EVPN is common in Data Centers
Deep observability and proactive insights are provided into the EVPN/VXLAN data plane and control plane:
ECMP aware inner packet tracing across the fabric to determine the path taken by application packets encapsulated in VXLAN
Proactive detection of EVPN control plane routing anomalies
Proactive detection of hardware memory exhaustion for EVPN routes
Topology Auto-Discovery and Time Machine Visualization
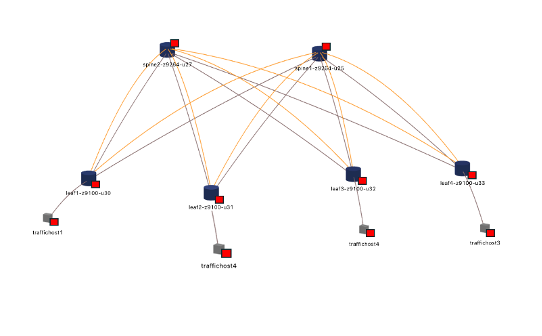
Data Center layer 2, layer 3, VXLAN and EVPN topology is automatically discovered and visualized across the fabric and servers:
Operator provided metadata including the role of devices (e.g., leaf, spine), data center PODs and fabrics augments the auto-discovered topology
Hierarchical zoom-in and zoom-out visualization enabling operators to visualize thousands of switches and routers
Time machine-based visualization of metrics, events, and anomalies on the topology
Conclusion
Data center performance and availability management is one of the most challenging areas of network operations today. Current generation monitoring and observability tools are manual, reactive, and noisy. Augtera Data Center customers are transferring their operations to being automated, proactive, and operationally relevant, dramatically improving their KPIs.
The foundation of the Data Center Solution is the Network AI platform which ingests a large scope of data types with high-performance, scale, and efficiency prior to automating anomaly detection, noise elimination, incident root identification, trouble ticket creation and notification.
In addition to the many platform advantages, Augtera Networks has spent several years, working closely with Data Center clients to address a range of pain points, constructs, equipment types and more.
The result is the industry’s leading Data Center Network Operations Tool.
Purpose Built for the Data Center
The Data Center Network AIOps solution results from three years of close development with network operations teams overseeing some of the largest data center networks. Based on Augtera’s Network AIOps platform, the solution addresses key Data Center pain points and use cases, in addition to supporting required APIs, ITSM integrations, vendor integrations, equipment types, data types and constructs. For more information on these aspects of the solution, see Augtera Networks Data Center Solution Brief.
Data center network and service architectures have changed dramatically over the last decade resulting in the emergence of new complexities that cannot be managed with old solutions. The Augtera platform transforms manual, reactive, and noisy to automated, proactive, and relevant for the following domains:
Applications
Hybrid Cloud
Underlays and Overlays
Switches & routers
Firewalls and Load Balancers
Augtera’s platform is production proven at scale, with customers realizing the following benefits:
90%+ reduction in Mean Time to Detect (MTTD)
50%+ reduction in Mean Time to Mitigation (MTTM)
40%+ reduction in Mean Time to Repair (MTTR)
4x+ improvement of Mean Time Between Incidents
Anomalies never seen before are now visible, noise is eliminated, mitigation is occurring rapidly, there are less incidents that need to be ticketed, and more time between incidents. Data center operations is being transformed from manual, reactive, and noisy to automated, proactive, and relevant.
Data Center Challenges
Modern data center architectures comprise Layer 3 Clos fabrics, often built using BGP. This provides equal cost multipath (ECMP) between top-of-rack (ToR) switches that can utilize all links for east-west traffic between any two switches. This is highly beneficial for scale, resiliency and optimal bandwidth utilization. At the same time it creates operational challenges that stem from “lots of links”.
The Landscape and challenges described here are not limited to hyper scale data centers. Data centers of all sizes have similar challenges.
Application uptime and performance is becoming even more critical to business.
Increasing failure points across control and data plane
Heterogeneous Environments
Hard to detect failures are common
Legacy tools and processes are manual, reactive, and noisy
Driven by SaaS, Hybrid Cloud, digital transformation, and other trends, application uptime and performance are becoming even more critical to business. Networking teams are accountable to the business. Operation teams need to plan for business and application continuity.
There are multiple drivers for increasing failure points including dense multipath architectures that create operational challenges from “Lots of Links”, cloud Interconnects from the data center to the cloud, and virtual networks in the public cloud.
Heterogeneous Environments
Multi-vendor implementations
Increasing use of disaggregation & white labeled hardware
Hard to detect failures are common
Transient control plane and hardware failures
Grey failures / brownouts
Long-lived failures
Legacy tools and processes are manual, reactive, and noisy
Significant time to detect, mitigate, and repair operational issues.
Application owners complain of problems before operations teams’ act
Foundation Capabilities
There are several capabilities that are foundational / common to the data center solution, independent of the domain (underlay, overlay, hybrid cloud,…), including:
Noise elimination
Automated notifications and ticketing
Autocorrelation
Proactively detecting gray failures
https://www.youtube.com/embed/pqtDyWiDdu4?feature=oembedAugtera Founder and CEO, Rahul Aggarwal, Tech Field Day / Networking Field Day 28, May, 2022
Noise Elimination
The Augtera platform takes a holistic approach to eliminating noise. Noise elimination is not the result of one technology or one approach. It is the result of understanding noise throughout the entire pipeline from ingestion to ticketing.
There are two major categories of noise elimination capabilities:
Selecting the strongest signals from a sea of noise
Policy-driven reduction of analysis and notification
Machine learning anomalies and insights detected by Augtera are automatically notified to Slack, Syslog, Kafka or ticketed to Service Now.
High fidelity proactive alerts & tickets that help transform operations to proactive from reactive
De-duplication aware to suppress duplicates while notifying
Duplicates are added as events against existing ticket state in Service Now
Auto-correlated events are added as events against the same Service Now ticket
Ticket life cycle aware
Data Center Use Cases & Auto-Mitigation / Remediation
Over three years of development, many Data Center Network Operations use cases have been addressed.
A couple of examples include:
Fabric/server latency & packet loss
Fabric congestion impact on application flows
Fabric / Server, Hybrid Cloud Latency & Packet Loss
In the Data Center, the network does not end at ToR (Top of Rack) switches, it extends all the way to servers. Detecting changes in latency and packet loss within the fabric, and all the way to servers is critical today. However, while other solutions stop at measurements, the Augtera Data Center Solution inputs the measurements, into Machine Learning (ML) based anomaly detection to find operationally relevant anomalies in latency and loss. The solution further inputs these anomalies along with other data sources, and performs multi-layer, topology- aware auto-correlation. The Augtera Data Center Solution uses Machine Learning (ML) models instead of static thresholds to reduce anomaly detection noise. Less noise, better insights. Augtera Networks latency and packet loss anomaly detection is also supported for Hybrid / Multi-Cloud.
Fabric Congestion Impact on Application Flows
It is one thing to know or suspect there is fabric congestion, it is another to know if that congestion is impacting applications. The Augtera Data Center Solution can determine if specific applications are experiencing performance degradation. It is critical today that network operations teams be able provide answers to application teams on the impact or innocence of the network with respect to Data Center / Cloud-based applications.
Auto-mitigation / remediation
Augtera Networks has worked with customers on a growing number of auto-mitigation / auto-remediation including:
Optical anomaly
BGP gray failure
Border router congestion
Data Center Autocorrelation
Multi-layer topology aware autocorrelation automatically correlates operationally relevant events and Augtera generated anomalies across the BGP and layer 2 control plane, IP and VXLAN data plane, synthetic probe anomalies, system and environmental degradation anomalies and other grey failures. The output of autocorrelation is “Augtera Incidents”.
This has several benefits:
Reduction of 25-75% in the number of incidents / tickets that NOC needs to manage
High fidelity context for root cause analysis, mitigation, and remediation. For example, Figure X shows an Augtera incident that auto-correlates 8 link and BGP flaps on 4 switches and identifies the mis-behaving switch that they are all connected to, even when the misbehaving switch does not generate any alerts.
Proactively Detect Grey Failures
Grey failures or brown outs refer to problems that are brewing and will eventually cause an outage. However, their effect is not immediately obvious. Applications may notice them and complain but they can be difficult to detect, trouble shoot and root cause. For example, intermittent packet drops can be the result of hardware issues, fiber issues, optical problems, or software issues.
Augtera anomaly detection algorithms on hundreds of metrics can detect significant pattern changes and detect control plane, data plane or hardware grey failures hours or days before the current reactive approaches.
Zero-day syslog anomalies can find the very first occurrence of an important syslog that indicates a grey failure. e.g., ASIC parity error.
Data Center Switching Fabric and Servers
Proactive Detection of Latency, Loss and Microbursts
Augtera agent can be deployed on hosts, leaf’s, and spines and enabled for synthetic probes
Probes continually measure loss and latency to each other
Augtera automatically learns normal loss/latency patterns between pair of devices and generates an anomaly when there is a degradation without thresholds or any other configuration
Anomalies can be overlayed on topology or viewed in heatmaps.
Augtera leverages peak buffer depth metrics from telemetry streaming, automatically learns the normal pattern for every queue and generates anomalies that detect microbursts
Proactively Detect Environmental and Optical Degradation
Early detection of temperature, fan speed, power, voltage and optical degradation via ML Anomaly Detection.
Traffic and Flow Mapping and Anomalies
Operators can map the path taken by a flow as well as the anomalies along the path in real-time or at a specific time interval in the past to determine the root cause of application issues
Anomaly detection on traffic utilization as an aggregate across a POD, fabric or data center interconnects to proactively detect unexpected major changes in traffic
Anomaly detection on TCP flags to detect SYN floods, unstable TCP sessions, etc.
Ad-hoc analytics to detect ECMP polarization on specific switches
Application Performance and Availability
Enables a customer to proactively determine increase in latency or loss across the data center fabric due to packet drops in the fabric and further determine the application flows responsible for the congestion.
https://www.youtube.com/embed/GV6KBCnZgLU?feature=oembedActionable Insights for Data Center, SE Director, John Heintz, Networking Field Day 28, May 2022
Augtera agents need to be installed on either the fabric leaf switches or servers. The solution encompasses:
Anomaly detection on probe latency and loss between agents
Anomaly detection on packet drops on fabric interfaces
Auto-correlation of probe anomalies and interface anomalies
Auto-notification / ticketing of Augtera incidents that contain both Probe and interface anomalies and detect Fabric Congestion
sFlow enablement on all leaf switches (for a 2 stage Clos) or spine switches with the Augtera stack configured as the sFlow collector
The above results in proactive notifications of increase in latency / loss across the fabric correlated with packet drops in the fabric. sFlow analysis enables an operator to find the flows transiting the interface on which packets are dropped at the time of the drops.
TCP Retransmit Anomalies and Impacted Flows
Augtera collects sFlow telemetry from the fabric. Augtera ML is configured to model the volume of TCP retransmits on a switch or interface and identifies when there is an operationally relevant pattern change. Operator can then use Augtera analytics to identify the impacted flows. Augtera can also automatically identify if there are fabric interfaces that are responsible for the retransmissions or prove that the network is innocent.
Firewall and Load Balancer Anomalies and Observability
Augtera integrates with a wide range of firewall and load balancer vendors and ingests metric, log and flow data.
Augtera can automatically detect a spike in rejected flows as well as identify the specific flows
Zero Day syslog anomalies can detect the first occurrence of rare syslog messages that identify firewall or load balancer issues
Traffic and flow anomalies described above are applicable to firewall and load balancer infrastructure
Hybrid Cloud
Hybrid Cloud Traffic, Flow, Latency and Loss Anomalies
Several of the solutions described above are applicable to Hybrid Cloud:
Aggregate traffic anomalies on data center to public cloud interconnects
Flow observability, analytics and anomalies based on sFlow and IPFIX streamed from data center border routers or from VPC flow logs in the public cloud
Deployment of Augtera agents on public cloud VMs and data center servers and switches to detect hybrid cloud loss and latency degradation
Integration with server and VM metrics and logs in the data center as well as with public cloud VM metrics and logs
NetOps / DevOps Friendly APIs
There are numerous short and long-term drivers for APIs. In the short-term, an operations team may not be able to provide direct access to a data source for a Network Operations tool. Sometimes the export of data to a file is explored, and maybe the only option. However, this is far from optimal. It is not dynamic for one. In these cases, Augtera provides its own APIs and support for other APIs. In the long-term, the transition to NetOps and DevOps-friendly Network Operations is the main driver for supporting and providing APIs.
Augtera Networks is always exploring with customers what APIs to support and what APIs to provide for the Data Center Solution. Two APIs that have been powerful in Data Center Solutions are:
Meta-Information API
Topology API
There are many powerful uses of Meta-Information, including data / alert enrichment. Of particular concern to Network Operations teams is communicating to Network Operations tools when to suppress alarms. For example, a Network Operations team may know that it is performing maintenance, so it does not need alarms for impacted elements.
Augtera believes strongly that auto-correlation needs to be topology-aware to effectively identify the root of an incident, which is why topology auto-discovery is provided in the base platform. However, there are times that Network Operations teams cannot provide use of the protocols needed to do auto-discovery. For these occasions, using an API is a good alternative.
ITSM Integrations
All Network Operations teams have a “job to be done”, and that job cannot be done unless tools are integrated into / aware-of processes and workflows. Any tool vendor can say they support an API. The “rubber meets the road” on the question of whether a tool is enabling the network operations team to get their job done.
There are numerous ways in which Augtera has worked with Data Center Network Operations teams to support workflows and processes.
ServiceNow tickets are often the trigger for scheduling skilled engineers to act on an incident. As skilled engineers are a scarce resource, it is critical that no noise is injected into ServiceNow. The Augtera Networks Data Center Solution eliminates noise from anomaly detection and ingestion of multiple data sources, suppresses maintenance incidents, de-duplicates, and provides customer policy definition that indicates what is operationally relevant and what is high or low priority.
As Network Operations teams seek to be more collaborative, tools like Slack have been adopted. Augtera Networks provides alerts / visualizations within Slack.
Data Center Relevant Equipment Types and Multi-Vendor
Augtera Networks is inherently differentiated from single-vendor / single-vendor-oriented solutions by broad multi-vendor support. While equipment vendors are often motivated to provide better support for their own equipment, Augtera Networks is motivated to provide robust multi-vendor support.
The Augtera Data Center Solution supports any network object that uses standard interfaces. Some of the vendors / technologies that Augtera has production proven support for data center and hybrid cloud operations include:
Data Center Data Types
Network AIOps begins with ingesting the data needed to develop the insights and actions that transform Network Operations. Any Data Center Solution must support the needed data.
Augtera Networks has found SNMP and Syslog is fundamental to most solutions. In fact, some solutions can be provided with Syslog only. For the Data Center Solution, sFLOW and IPFIX are important for anomaly detection involving flows and application performance degradation. For some SD-WAN offerings, IPFIX is the only flow data supported.
OpenConfig and gRPC/gNMI are emerging approaches. While implementations are still maturing in many cases, support is critical for some Data Center equipment and customer preferences. VPC Flow Log support extends the Data Center Solution to cloud environments.
Synthetic agents for latency and loss are critical because other telemetry data does not provide this information. Kafka is an increasingly important transport for many data types.
The Augtera Data Center Solution also supports the Mirror on Drop (MOD) Broadcom chip capability enabled on Dell Enterprise SONiC, in addition to Dell Enterprise SONiC streaming telemetry.
Data Center Constructs
Every networking environment has potentially different constructs that need to be supported, because of network architecture and design considerations inherent to that environment.
For Data Center environments, there are numerous constructs that need to be supported. Some already mentioned in this paper include physical, optical, Ethernet, underlays, overlays, and SD-WAN. The Data Center has other unique constructs like Top of Rack, spine switches, PODs, L3 Clos Fabrics, and Data Center Interconnects (DCIs).
Why does this matter? What if a network operations team decides they want to understand anomalies at the POD aggregate level? Then the POD construct must be supported by the solution. What if a network operations team decides links from a ToR to a server are not high priority from a notification perspective, but ToR uplinks are? Then the ToR construct must be supported and understood.
If the constructs important to data center environments are not understood and integrated into the solution, then important noise reduction, notification, and analysis policies cannot be realized.
VXLAN and EVPN is common in Data Centers
Deep observability and proactive insights are provided into the EVPN/VXLAN data plane and control plane:
ECMP aware inner packet tracing across the fabric to determine the path taken by application packets encapsulated in VXLAN
Proactive detection of EVPN control plane routing anomalies
Proactive detection of hardware memory exhaustion for EVPN routes
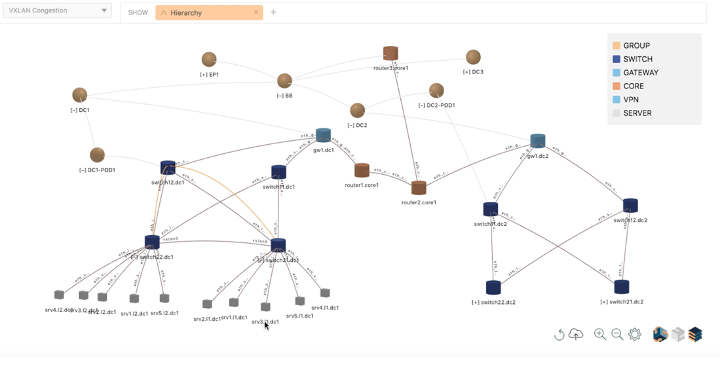
Topology Auto-Discovery and Time Machine Visualization
Data Center layer 2, layer 3, VXLAN and EVPN topology is automatically discovered and visualized across the fabric and servers:
Operator provided metadata including the role of devices (e.g., leaf, spine), data center PODs and fabrics augments the auto-discovered topology
Hierarchical zoom-in and zoom-out visualization enabling operators to visualize thousands of switches and routers
Time machine-based visualization of metrics, events, and anomalies on the topology
Conclusion
Data center performance and availability management is one of the most challenging areas of network operations today. Current generation monitoring and observability tools are manual, reactive, and noisy. Augtera Data Center customers are transferring their operations to being automated, proactive, and operationally relevant, dramatically improving their KPIs.
Recently, Enterprise Management Associates (EMA) surveyed over 400 Networking / IT professionals responsible for Networking Tools to get deeper insights into Network Observability. Augtera Networks did not sponsor or influence the research. Responses from Network Practitioners on tool complaints focused on Data Quality and Scalability. Responses from IT leaders focused on Scope and Expense. This blog looks at the survey results and discusses the issues.
Comparing the Results of Network Tool Complaints
While it is not surprising that people using tools everyday might have a different perspective on the biggest issues than those in leadership roles, important insights come from examining those differences. The below table lists Network Tools complaints from highest to lowest.
For Network Practitioners, Poor Data Quality and Insufficient Scalability are related. Often the inability to scale leads to gaps in the data, for example. Especially in the era where Network Operations teams are looking to have many data sources ingested by a common tool, scalability is essential. Some Enterprises will require the ability to ingest hundreds of millions of data points per hour.
Scalability is not just the ability to collect data on millions of data sources, but also to collect data at a high frequency. For some metrics collecting data every 5 minutes may be sufficient, while for others, for example latency and loss information, collecting data every 10, 20, or 30 seconds may be desired.
On the other hand, the top complaints from IT leaders are Limited Scope and Expense. These issues are also related. IT leaders want to get tool proliferation under control because of expense and triage inefficiency. To make a meaningful dent in tool proliferation, IT leaders will need tools that have a large scope, the ability to ingest many data types.
Lastly it is interesting to note that today’s monitoring and observability tools are seen as lacking insights by both Network Practitioners and IT leaders.
Conclusion on Network Tool Complaints
While there is little disagreement on what the overall list of complaints are, different roles in a company may rank those issues differently, based on their objectives and day-to-day experience with network tools.
Those with hands on day-to-day experience are focused on the very practical issues of data quality and scalability. Those focused on setting future directions and achieving larger overall IT objectives are focused on tool scope and expense. Next generation tools must address all these issue and stakeholders.
Notes
Augtera’s summarization of the EMA data:
Large Enterprises were selected
Network Practitioners was defined as: Network Architect, Network Engineer/Analyst, Network Tools Engineer / architect, Site Reliability Engineer
IT Leadership was defined as: IT Manager, IT Director, IT VP, IT CxO
In a time of great change in networking, the need for network operations productivity improvements has never been more pressing. Tools proliferation, data availability, and network complexity have created an environment of ticket overload, increasing manual work, and less insight. The next generation of network operations tools must automate tasks that humans are less proficient at, reduce the overall ticket load, and provide better insights. Network AIOps is leading the way.
Tools Proliferation and Productivity
Historically, network tool vendors have focused on deep analysis of one specific data type. As a result, Network Operations teams have SNMP trap monitors, metric visualization dashboards, log management systems, flow analysis solutions, and more. This proliferation is exacerbated by vendor-specific tools.
Not only does this create growing manual correlation work across different tools when an incident occurs, but it also limits the insights that comes from correlation across all data. That insight includes reducing redundant / irrelevant data and identifying the incident root. In some Network Operations environments, different tool owners must first have a meeting or conference call to align on where triage should begin. This time can vary, but times of 40-60 minutes have been reported across multiple companies.
Network AIOps brings many data sources together in one normalized, searchable network model so correlation can occur across all data. With a purpose-built network model, and multi-layer topology-based auto-correlation, one Fortune 500 customer saw the time to act reduced from over 40 minutes to 1 minute. Single-data type tools may still play a role in deep-dive analysis for hard to remediate problems, but their use as the first line of anomaly detection and action has been surpassed by Network AIOps.
Data Availability and Productivity
The volume, velocity, and variety of data has increased in all areas of IT, including operations. Network tools must be able to effectively process large volumes of data in a day, they must also be able to process data at small sub-minute periods, sometimes as small as every ten seconds. Designing network tools for both high daily volumes and high velocity frequency was not a significant consideration with historical tools, and certainly not for multiple data types at the same time.
A network tool may be humming along well for a single data type. However, what happens when high-frequency collection is added for millions of switch queues? Can the extra load be supported? A network tool architecture must assume future new collection and analysis requirements.
In addition to being high performance, tools must be highly efficient. Some tools are not even capable of horizontal scaling. Those that are, can perhaps argue that theoretically with enough resources, they can scale to any requirement. However, Network Operations teams do not have access to infinite resources. Rather, they are often resource constrained. Productivity is not just a function of human labor, but also of IT expenses.
Network Complexity and Productivity
Containers and microservices “broke” the traditional application and compute infrastructure approach by IT operations tools. Network Operations has experienced a similar challenge. Underlays, overlays, SD-WAN, hybrid cloud, multi-cloud, and endpoint proliferation require a new approach.
Network AIOps platforms that auto-discover multi-layer relationships, including topology, physical, optical, Ethernet, IP, and TCP, can quickly recognize which alerts / tickets are related and identify the lowest level of incident root information. A capability that does not exist in IT AIOps platforms.
Rapid Incident Root identification dramatically cuts the time to action, as well as overall mitigation and remediation times.
Conclusion
Network Operations teams are faced with growing pressure: hard to find & retain talent, increasing data, increasing network & operations complexity. In addition, the next couple of years are likely to see increasing budget constraints.
Network Operations teams must do more with less. Tools must dramatically increase Network Operations productivity, eliminating redundant / irrelevant tickets, reducing the complexity of identifying incident root, and efficiently scaling. Augtera’s Network AI is attacking these issues and our customers are seeing a 90%+ reduction in trouble tickets, 90% reduction in time to act, 50% reduction in mitigation times, and 40%+ improvement in remediation times. The time between incidents is also increasing by 4x or more.
Contact Us to have an Augtera Networks Engineer give you a demonstration.
Network AI can see incidents before they become service impacting
PALO ALTO, Calif. November 8th, 2022 (BUSINESS WIRE) Augtera Networks, the industry leader in AI/ML-powered Network Operations Solutions, today announced that Vyve Broadband is using the Augtera Networks, Network AI platform in production, to prevent future incidents.
“We are pleased to partner with Vyve Broadband, in this transformative journey to prevent incidents from occurring,” said Rahul Aggarwal, Founder and CEO of Augtera Networks. “Augtera’s Network AI is purpose-built for networking, capable of detecting anomalies that have the potential to become more significant incidents. We can do this at any layer of the stack, from the physical layer to the TCP layer, and even beyond with our agent technology. Network AI also detects rare / new log messages which often precede outages.”
Like Network Operations teams for any Enterprise, environmental failures can have a significant impact on the availability and performance of IT infrastructure. Environmental conditions often degrade over time. With traditional threshold-based management, degradation is either not detected at all, or leads to many false positives because normal variations and patterns are not understood.
Augtera’s Network AI uses 9+ purpose-built AI/ML algorithms that understand network patterns and detect gray failures before they become outages.
“With Augtera we are able to prevent facility failures by getting advanced notification when our environmental system begins to degrade.” – Ken Branscum, Director of Operations, Vyve Broadband.
Network AI can detect many types of gray failures including:
Augtera Networks eliminates noise, enables proactive operations, and prevents incidents, for Enterprise and Service Provider networks. The first AI/ML-powered network operations platform, Augtera is being used by hyperscale cloud platforms, financial institutions, communications service providers, managed service providers, and enterprises in multiple verticals. Additional information can be found at www.augtera.com