Introduction
The foundation of the Data Center Solution is the Network AI platform which ingests a large scope of data types with high-performance, scale, and efficiency prior to automating anomaly detection, noise elimination, incident root identification, trouble ticket creation and notification.

In addition to the many platform advantages, Augtera Networks has spent several years, working closely with Data Center clients to address a range of pain points, constructs, equipment types and more.

The result is the industry’s leading Data Center Network Operations Tool.
Purpose Built for the Data Center
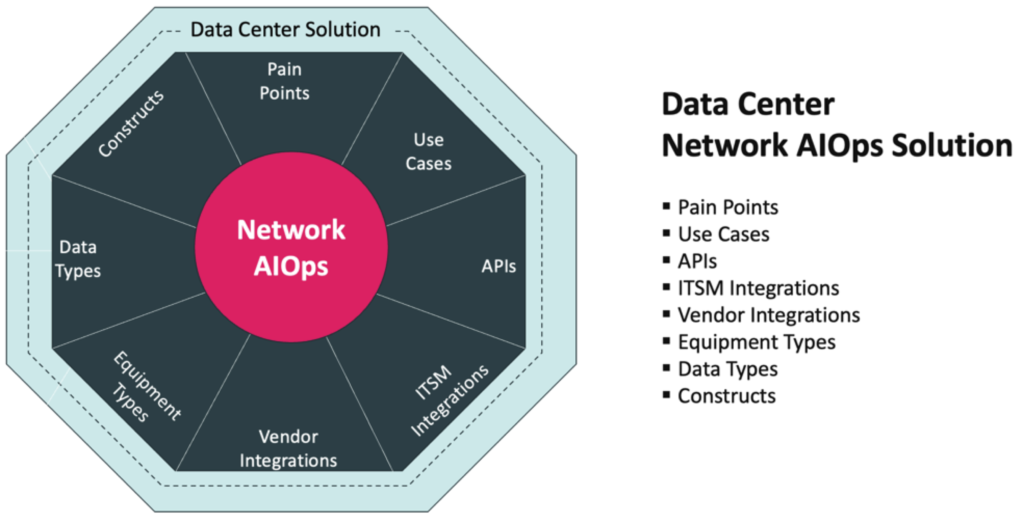
The Data Center Network AIOps solution results from three years of close development with network operations teams overseeing some of the largest data center networks. Based on Augtera’s Network AIOps platform, the solution addresses key Data Center pain points and use cases, in addition to supporting required APIs, ITSM integrations, vendor integrations, equipment types, data types and constructs. For more information on these aspects of the solution, see Augtera Networks Data Center Solution Brief.
Data center network and service architectures have changed dramatically over the last decade resulting in the emergence of new complexities that cannot be managed with old solutions. The Augtera platform transforms manual, reactive, and noisy to automated, proactive, and relevant for the following domains:
- Applications
- Hybrid Cloud
- Underlays and Overlays
- Switches & routers
- Firewalls and Load Balancers
Augtera’s platform is production proven at scale, with customers realizing the following benefits:
- 90%+ reduction in Mean Time to Detect (MTTD)
- 50%+ reduction in Mean Time to Mitigation (MTTM)
- 40%+ reduction in Mean Time to Repair (MTTR)
- 4x+ improvement of Mean Time Between Incidents
Anomalies never seen before are now visible, noise is eliminated, mitigation is occurring rapidly, there are less incidents that need to be ticketed, and more time between incidents. Data center operations is being transformed from manual, reactive, and noisy to automated, proactive, and relevant.
Data Center Challenges
Modern data center architectures comprise Layer 3 Clos fabrics, often built using BGP. This provides equal cost multipath (ECMP) between top-of-rack (ToR) switches that can utilize all links for east-west traffic between any two switches. This is highly beneficial for scale, resiliency and optimal bandwidth utilization. At the same time it creates operational challenges that stem from “lots of links”.
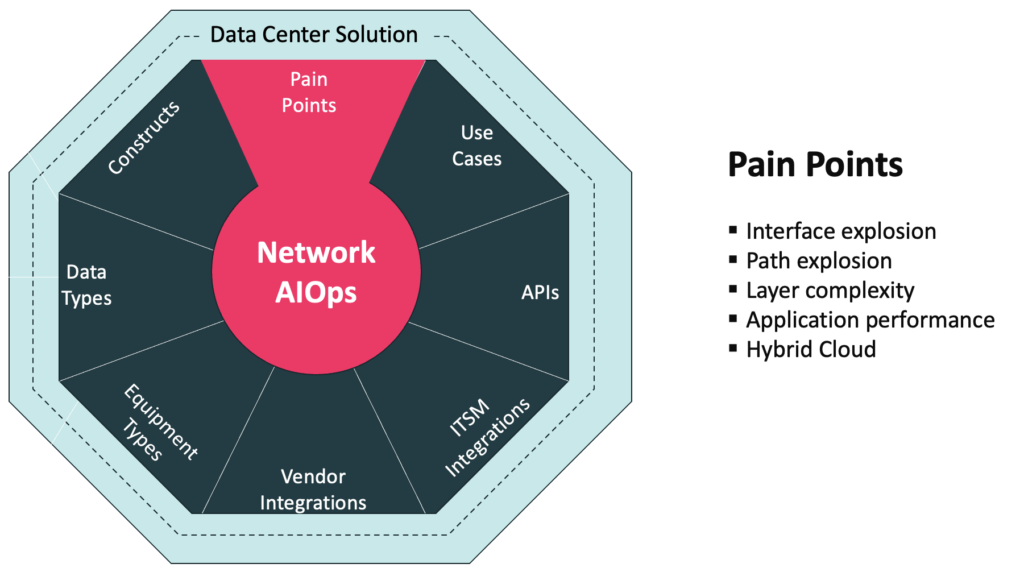
The Landscape and challenges described here are not limited to hyper scale data centers. Data centers of all sizes have similar challenges.
- Application uptime and performance is becoming even more critical to business.
- Increasing failure points across control and data plane
- Heterogeneous Environments
- Hard to detect failures are common
- Legacy tools and processes are manual, reactive, and noisy
Driven by SaaS, Hybrid Cloud, digital transformation, and other trends, application uptime and performance are becoming even more critical to business. Networking teams are accountable to the business. Operation teams need to plan for business and application continuity.
There are multiple drivers for increasing failure points including dense multipath architectures that create operational challenges from “Lots of Links”, cloud Interconnects from the data center to the cloud, and virtual networks in the public cloud.
- Heterogeneous Environments
- Multi-vendor implementations
- Increasing use of disaggregation & white labeled hardware
- Hard to detect failures are common
- Transient control plane and hardware failures
- Grey failures / brownouts
- Long-lived failures
- Legacy tools and processes are manual, reactive, and noisy
- Significant time to detect, mitigate, and repair operational issues.
- Application owners complain of problems before operations teams’ act
Foundation Capabilities
There are several capabilities that are foundational / common to the data center solution, independent of the domain (underlay, overlay, hybrid cloud,…), including:
- Noise elimination
- Automated notifications and ticketing
- Autocorrelation
- Proactively detecting gray failures
Noise Elimination
The Augtera platform takes a holistic approach to eliminating noise. Noise elimination is not the result of one technology or one approach. It is the result of understanding noise throughout the entire pipeline from ingestion to ticketing.
There are two major categories of noise elimination capabilities:
- Selecting the strongest signals from a sea of noise
- Policy-driven reduction of analysis and notification
Learn more at Noise Elimination
Automated Notifications and Ticketing
Machine learning anomalies and insights detected by Augtera are automatically notified to Slack, Syslog, Kafka or ticketed to Service Now.
- High fidelity proactive alerts & tickets that help transform operations to proactive from reactive
- De-duplication aware to suppress duplicates while notifying
- Duplicates are added as events against existing ticket state in Service Now
- Auto-correlated events are added as events against the same Service Now ticket
- Ticket life cycle aware
Data Center Use Cases & Auto-Mitigation / Remediation
Over three years of development, many Data Center Network Operations use cases have been addressed.
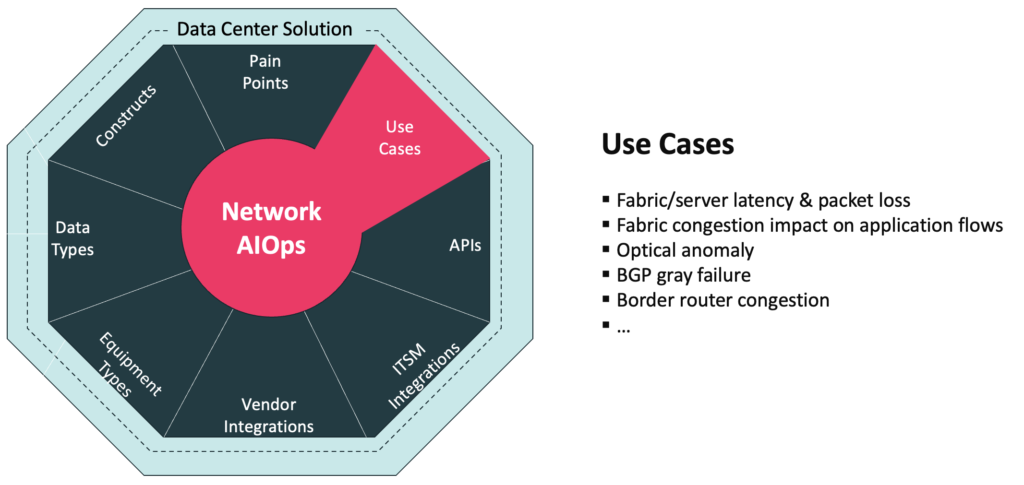
A couple of examples include:
- Fabric/server latency & packet loss
- Fabric congestion impact on application flows
Fabric / Server, Hybrid Cloud Latency & Packet Loss
In the Data Center, the network does not end at ToR (Top of Rack) switches, it extends all the way to servers. Detecting changes in latency and packet loss within the fabric, and all the way to servers is critical today. However, while other solutions stop at measurements, the Augtera Data Center Solution inputs the measurements, into Machine Learning (ML) based anomaly detection to find operationally relevant anomalies in latency and loss. The solution further inputs these anomalies along with other data sources, and performs multi-layer, topology- aware auto-correlation. The Augtera Data Center Solution uses Machine Learning (ML) models instead of static thresholds to reduce anomaly detection noise. Less noise, better insights. Augtera Networks latency and packet loss anomaly detection is also supported for Hybrid / Multi-Cloud.
Fabric Congestion Impact on Application Flows
It is one thing to know or suspect there is fabric congestion, it is another to know if that congestion is impacting applications. The Augtera Data Center Solution can determine if specific applications are experiencing performance degradation. It is critical today that network operations teams be able provide answers to application teams on the impact or innocence of the network with respect to Data Center / Cloud-based applications.
Auto-mitigation / remediation
Augtera Networks has worked with customers on a growing number of auto-mitigation / auto-remediation including:
- Optical anomaly
- BGP gray failure
- Border router congestion
Data Center Autocorrelation
Multi-layer topology aware autocorrelation automatically correlates operationally relevant events and Augtera generated anomalies across the BGP and layer 2 control plane, IP and VXLAN data plane, synthetic probe anomalies, system and environmental degradation anomalies and other grey failures. The output of autocorrelation is “Augtera Incidents”.
This has several benefits:
- Reduction of 25-75% in the number of incidents / tickets that NOC needs to manage
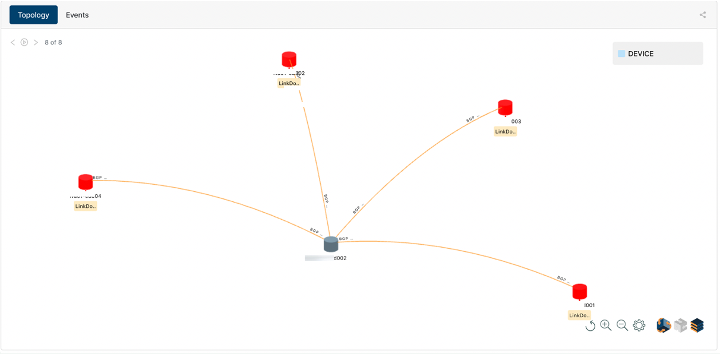
- High fidelity context for root cause analysis, mitigation, and remediation. For example, Figure X shows an Augtera incident that auto-correlates 8 link and BGP flaps on 4 switches and identifies the mis-behaving switch that they are all connected to, even when the misbehaving switch does not generate any alerts.
Proactively Detect Grey Failures
Grey failures or brown outs refer to problems that are brewing and will eventually cause an outage. However, their effect is not immediately obvious. Applications may notice them and complain but they can be difficult to detect, trouble shoot and root cause. For example, intermittent packet drops can be the result of hardware issues, fiber issues, optical problems, or software issues.
- Augtera anomaly detection algorithms on hundreds of metrics can detect significant pattern changes and detect control plane, data plane or hardware grey failures hours or days before the current reactive approaches.
- Zero-day syslog anomalies can find the very first occurrence of an important syslog that indicates a grey failure. e.g., ASIC parity error.
Data Center Switching Fabric and Servers
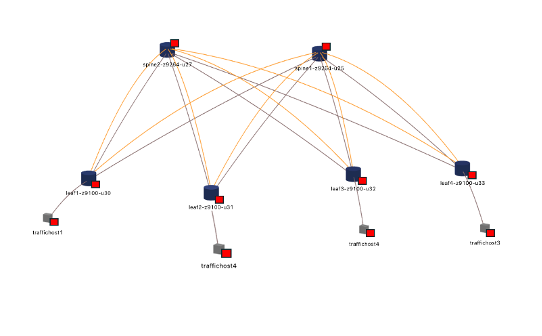
Proactive Detection of Latency, Loss and Microbursts
- Augtera agent can be deployed on hosts, leaf’s, and spines and enabled for synthetic probes
- Probes continually measure loss and latency to each other
- Augtera automatically learns normal loss/latency patterns between pair of devices and generates an anomaly when there is a degradation without thresholds or any other configuration
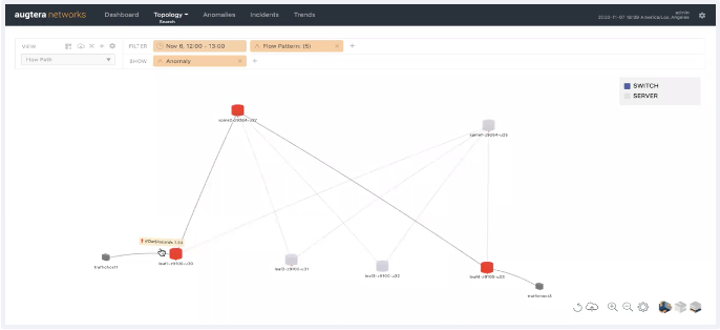
- Anomalies can be overlayed on topology or viewed in heatmaps.
- Augtera leverages peak buffer depth metrics from telemetry streaming, automatically learns the normal pattern for every queue and generates anomalies that detect microbursts
Proactively Detect Environmental and Optical Degradation
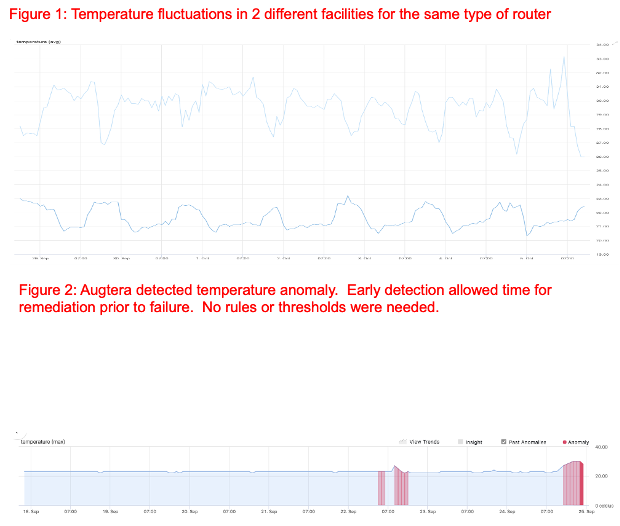
Early detection of temperature, fan speed, power, voltage and optical degradation via ML Anomaly Detection.
Traffic and Flow Mapping and Anomalies
- Operators can map the path taken by a flow as well as the anomalies along the path in real-time or at a specific time interval in the past to determine the root cause of application issues
- Anomaly detection on traffic utilization as an aggregate across a POD, fabric or data center interconnects to proactively detect unexpected major changes in traffic
- Anomaly detection on TCP flags to detect SYN floods, unstable TCP sessions, etc.
- Ad-hoc analytics to detect ECMP polarization on specific switches
Application Performance and Availability
Enables a customer to proactively determine increase in latency or loss across the data center fabric due to packet drops in the fabric and further determine the application flows responsible for the congestion.
Augtera agents need to be installed on either the fabric leaf switches or servers. The solution encompasses:
- Anomaly detection on probe latency and loss between agents
- Anomaly detection on packet drops on fabric interfaces
- Auto-correlation of probe anomalies and interface anomalies
- Auto-notification / ticketing of Augtera incidents that contain both Probe and interface anomalies and detect Fabric Congestion
- sFlow enablement on all leaf switches (for a 2 stage Clos) or spine switches with the Augtera stack configured as the sFlow collector
The above results in proactive notifications of increase in latency / loss across the fabric correlated with packet drops in the fabric. sFlow analysis enables an operator to find the flows transiting the interface on which packets are dropped at the time of the drops.
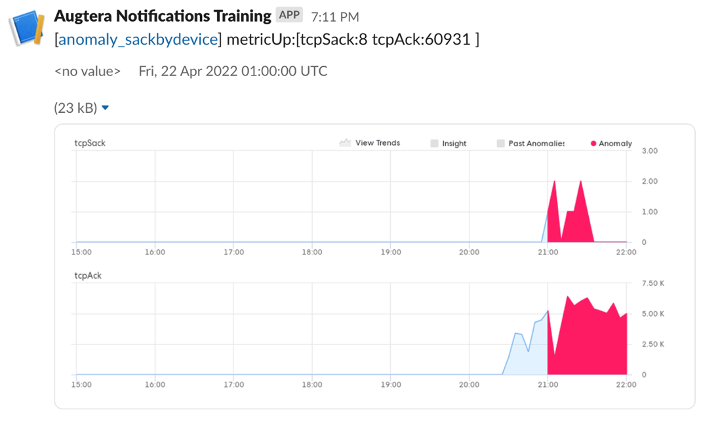
TCP Retransmit Anomalies and Impacted Flows
Augtera collects sFlow telemetry from the fabric. Augtera ML is configured to model the volume of TCP retransmits on a switch or interface and identifies when there is an operationally relevant pattern change. Operator can then use Augtera analytics to identify the impacted flows. Augtera can also automatically identify if there are fabric interfaces that are responsible for the retransmissions or prove that the network is innocent.
Firewall and Load Balancer Anomalies and Observability
Augtera integrates with a wide range of firewall and load balancer vendors and ingests metric, log and flow data.
- Augtera can automatically detect a spike in rejected flows as well as identify the specific flows
- Zero Day syslog anomalies can detect the first occurrence of rare syslog messages that identify firewall or load balancer issues
- Traffic and flow anomalies described above are applicable to firewall and load balancer infrastructure
Hybrid Cloud
Hybrid Cloud Traffic, Flow, Latency and Loss Anomalies
Several of the solutions described above are applicable to Hybrid Cloud:
- Aggregate traffic anomalies on data center to public cloud interconnects
- Flow observability, analytics and anomalies based on sFlow and IPFIX streamed from data center border routers or from VPC flow logs in the public cloud
- Deployment of Augtera agents on public cloud VMs and data center servers and switches to detect hybrid cloud loss and latency degradation
- Integration with server and VM metrics and logs in the data center as well as with public cloud VM metrics and logs
NetOps / DevOps Friendly APIs
There are numerous short and long-term drivers for APIs. In the short-term, an operations team may not be able to provide direct access to a data source for a Network Operations tool. Sometimes the export of data to a file is explored, and maybe the only option. However, this is far from optimal. It is not dynamic for one. In these cases, Augtera provides its own APIs and support for other APIs. In the long-term, the transition to NetOps and DevOps-friendly Network Operations is the main driver for supporting and providing APIs.
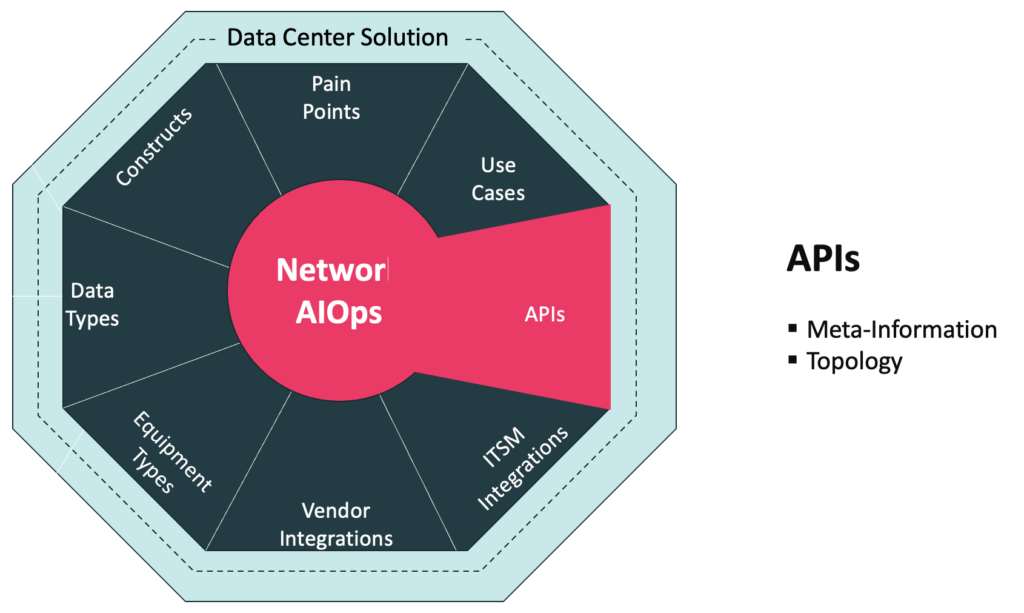
Augtera Networks is always exploring with customers what APIs to support and what APIs to provide for the Data Center Solution. Two APIs that have been powerful in Data Center Solutions are:
- Meta-Information API
- Topology API
There are many powerful uses of Meta-Information, including data / alert enrichment. Of particular concern to Network Operations teams is communicating to Network Operations tools when to suppress alarms. For example, a Network Operations team may know that it is performing maintenance, so it does not need alarms for impacted elements.
Augtera believes strongly that auto-correlation needs to be topology-aware to effectively identify the root of an incident, which is why topology auto-discovery is provided in the base platform. However, there are times that Network Operations teams cannot provide use of the protocols needed to do auto-discovery. For these occasions, using an API is a good alternative.
ITSM Integrations
All Network Operations teams have a “job to be done”, and that job cannot be done unless tools are integrated into / aware-of processes and workflows. Any tool vendor can say they support an API. The “rubber meets the road” on the question of whether a tool is enabling the network operations team to get their job done.
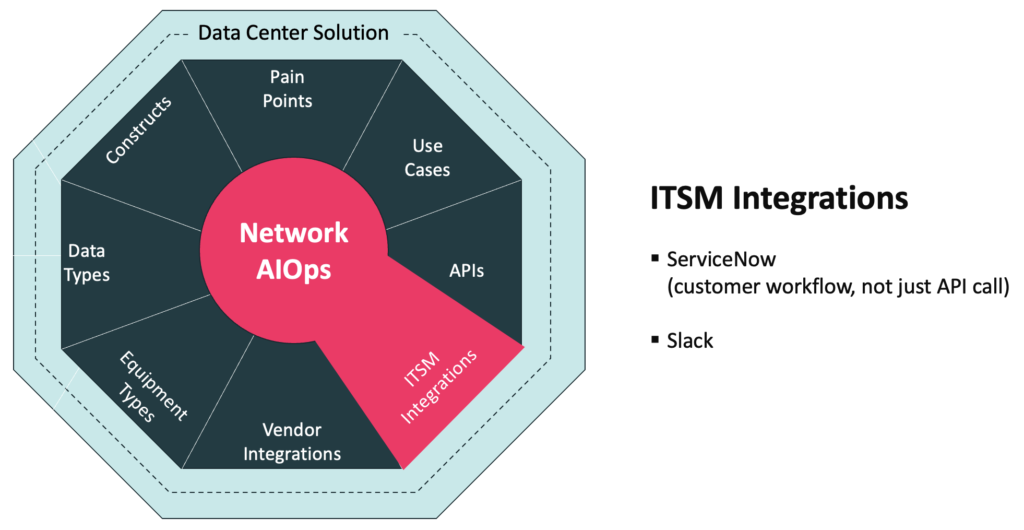
There are numerous ways in which Augtera has worked with Data Center Network Operations teams to support workflows and processes.
ServiceNow tickets are often the trigger for scheduling skilled engineers to act on an incident. As skilled engineers are a scarce resource, it is critical that no noise is injected into ServiceNow. The Augtera Networks Data Center Solution eliminates noise from anomaly detection and ingestion of multiple data sources, suppresses maintenance incidents, de-duplicates, and provides customer policy definition that indicates what is operationally relevant and what is high or low priority.
As Network Operations teams seek to be more collaborative, tools like Slack have been adopted. Augtera Networks provides alerts / visualizations within Slack.
Data Center Relevant Equipment Types and Multi-Vendor
Augtera Networks is inherently differentiated from single-vendor / single-vendor-oriented solutions by broad multi-vendor support. While equipment vendors are often motivated to provide better support for their own equipment, Augtera Networks is motivated to provide robust multi-vendor support.
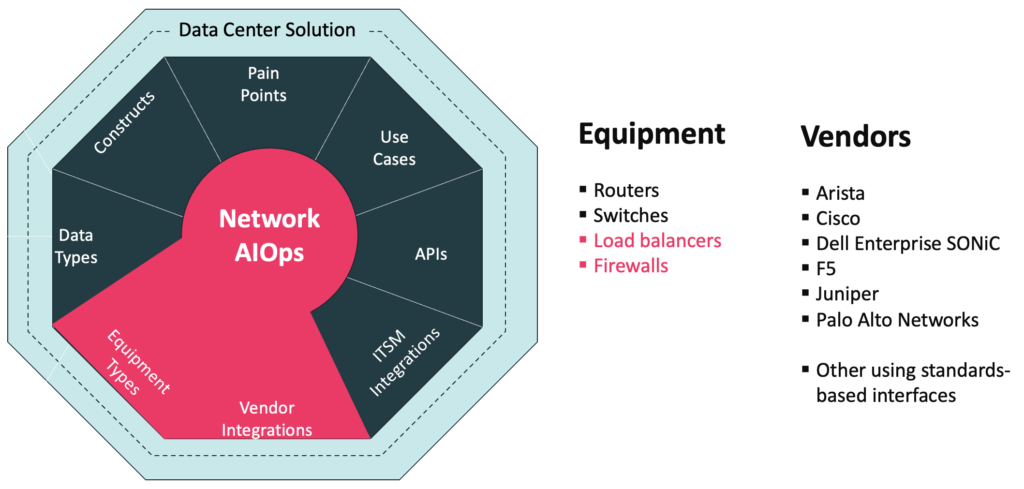
The Augtera Data Center Solution supports any network object that uses standard interfaces. Some of the vendors / technologies that Augtera has production proven support for data center and hybrid cloud operations include:




Data Center Data Types
Network AIOps begins with ingesting the data needed to develop the insights and actions that transform Network Operations. Any Data Center Solution must support the needed data.
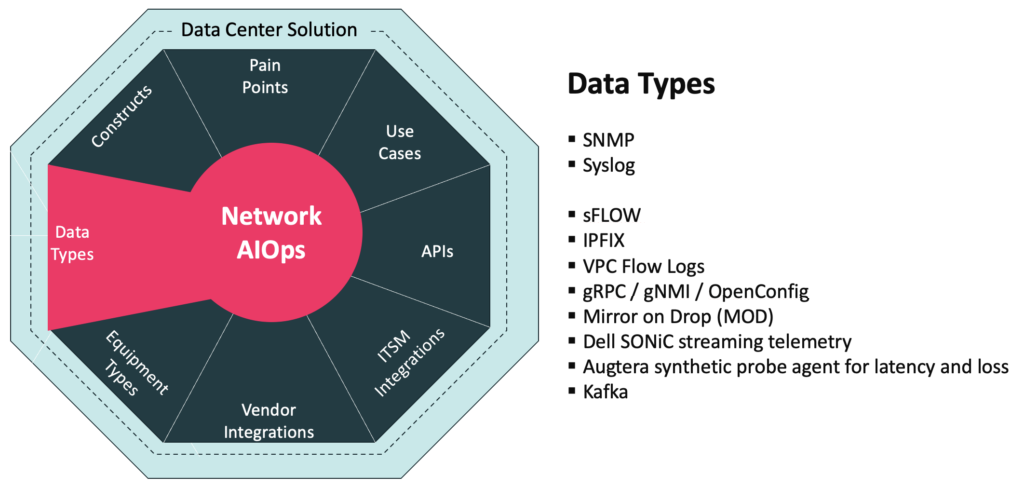
Augtera Networks has found SNMP and Syslog is fundamental to most solutions. In fact, some solutions can be provided with Syslog only. For the Data Center Solution, sFLOW and IPFIX are important for anomaly detection involving flows and application performance degradation. For some SD-WAN offerings, IPFIX is the only flow data supported.
OpenConfig and gRPC/gNMI are emerging approaches. While implementations are still maturing in many cases, support is critical for some Data Center equipment and customer preferences. VPC Flow Log support extends the Data Center Solution to cloud environments.
Synthetic agents for latency and loss are critical because other telemetry data does not provide this information. Kafka is an increasingly important transport for many data types.
The Augtera Data Center Solution also supports the Mirror on Drop (MOD) Broadcom chip capability enabled on Dell Enterprise SONiC, in addition to Dell Enterprise SONiC streaming telemetry.
Data Center Constructs
Every networking environment has potentially different constructs that need to be supported, because of network architecture and design considerations inherent to that environment.
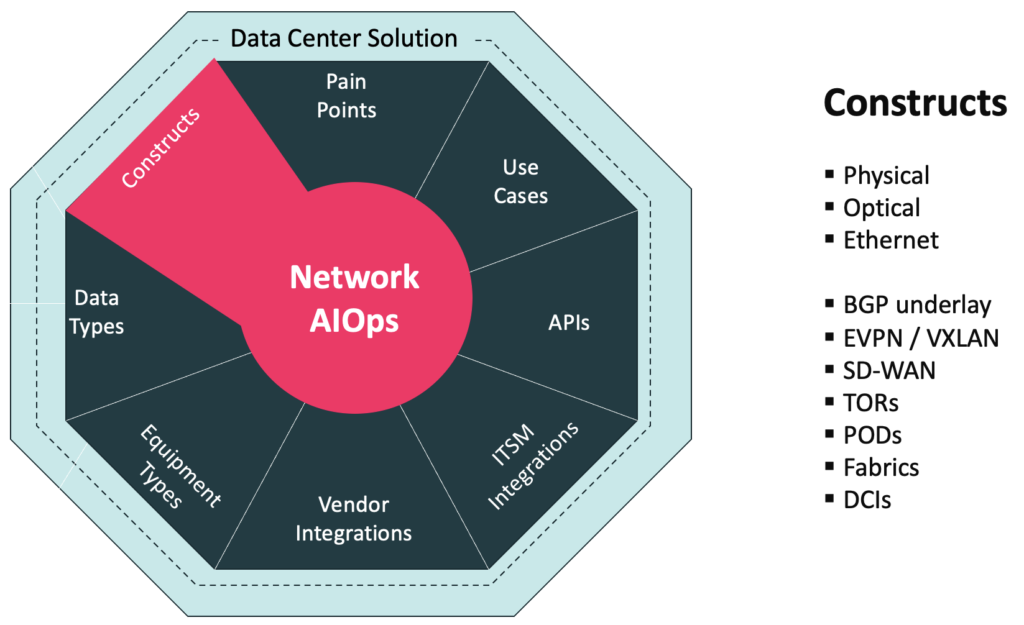
For Data Center environments, there are numerous constructs that need to be supported. Some already mentioned in this paper include physical, optical, Ethernet, underlays, overlays, and SD-WAN. The Data Center has other unique constructs like Top of Rack, spine switches, PODs, L3 Clos Fabrics, and Data Center Interconnects (DCIs).
Why does this matter? What if a network operations team decides they want to understand anomalies at the POD aggregate level? Then the POD construct must be supported by the solution. What if a network operations team decides links from a ToR to a server are not high priority from a notification perspective, but ToR uplinks are? Then the ToR construct must be supported and understood.
If the constructs important to data center environments are not understood and integrated into the solution, then important noise reduction, notification, and analysis policies cannot be realized.
VXLAN and EVPN is common in Data Centers
Deep observability and proactive insights are provided into the EVPN/VXLAN data plane and control plane:
- ECMP aware inner packet tracing across the fabric to determine the path taken by application packets encapsulated in VXLAN
- Proactive detection of EVPN control plane routing anomalies
- Proactive detection of hardware memory exhaustion for EVPN routes
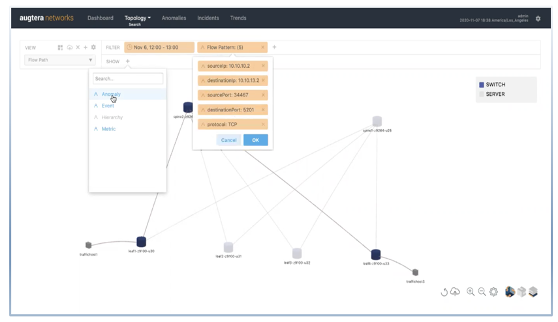
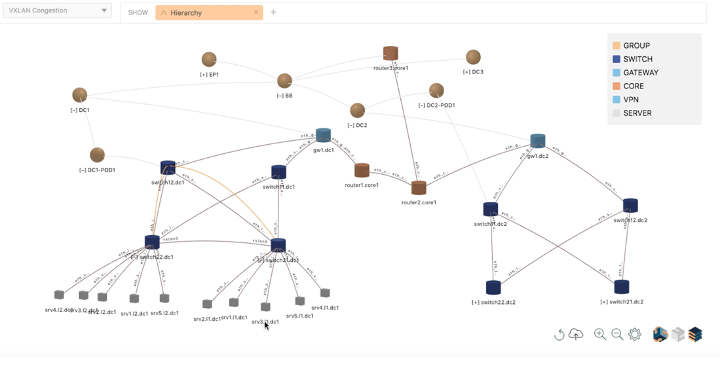
Topology Auto-Discovery and Time Machine Visualization
Data Center layer 2, layer 3, VXLAN and EVPN topology is automatically discovered and visualized across the fabric and servers:
- Operator provided metadata including the role of devices (e.g., leaf, spine), data center PODs and fabrics augments the auto-discovered topology
- Hierarchical zoom-in and zoom-out visualization enabling operators to visualize thousands of switches and routers
- Time machine-based visualization of metrics, events, and anomalies on the topology
Conclusion
Data center performance and availability management is one of the most challenging areas of network operations today. Current generation monitoring and observability tools are manual, reactive, and noisy. Augtera Data Center customers are transferring their operations to being automated, proactive, and operationally relevant, dramatically improving their KPIs.
For more information:
Related Links

