Orange integrates Augtera Network AI platform to its NOC tools to leverage AI/ML in daily network operations. This will reduce Network Operation Centers alarms by 70% and prevent failures.

Data Center Network Internist Wanted! AI/ML can help.

Data Center network internists are needed because of the complexity that has arisen from modern architectures. Router specialists, switch specialists, etc. remain critical, however, a new type of skill and network operations platform is required to address today’s complexity, just as it is in medicine, when an issue is larger in scope than a single organ.

What is a Medical Internist?

Internists are specialist internal medicine physicians, trained specifically to care for patients with multiple simultaneous problems or complex comorbidities. Treatment is provided for undifferentiated presentations that do not easily fit within the expertise of a single-organ specialty. Examples include dyspnea, fatigue, weight loss, chest pain, confusion, or change in conscious state. 

We use this medical role to make the analogy of a data center network internist.

Data Center Network Internist Relevance

The human body and Data Center architecture have many commonalities. The body contains organs such as heart, lungs, liver, stomach, gallbladder, interconnected by various “network-based” systems including arteries, veins, and capillaries. There is also a nervous system, musculoskeletal system, respiratory system, and digestive system.

A datacenter consists of:

  • A facility designed to optimize space and environmental control.
  • Core components including routers, switches, firewalls, load balancers, storage, & servers.
  • A multilayer network including optical, Ethernet, IP, underlays, overlays, SD-WAN, & segmentation.
  • Support infrastructure including UPS, HVAC, and physical access surveillance.

Each core component can be broken down into multiple network constructs with their own sub-systems. For example, a router has line cards, physical ports, queues and optical lanes.

Data Center networks show an even stronger analogy to the human body than WAN networks. Data Center networks are highly meshed and offer numerous connectivity paths. This makes finding an insight needle in the operations data haystack, more challenging than other network domains.

Data Center Internist Key Attributes

Applying key attributes of Internal Medicine to Network Operations:

  • Holistic. Ingesting and processing data from:
    • All elements, not just switches. See above.
    • Multiple data types, including SNMP, gRPC/gNMI/OpenConfig, syslog, probes, sflow, & meta
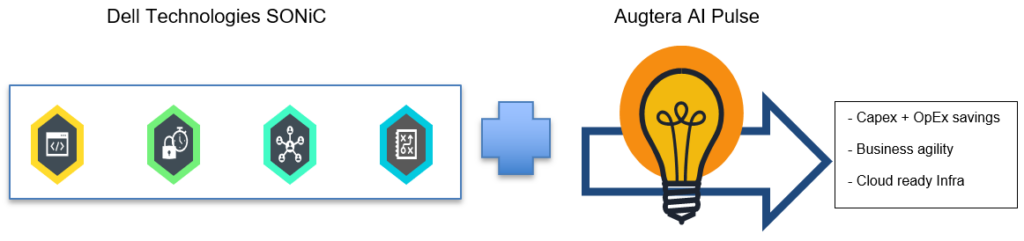
    • All vendors, including Cisco, Juniper, Arista, (Dell) SONiC, F5, Palo Alto and other standards-based elements
  • Model based:
    • Semantic understanding & interrelationships are critical, otherwise correlation will be limited.
    • Network model and knowledge should be part of the workflow.
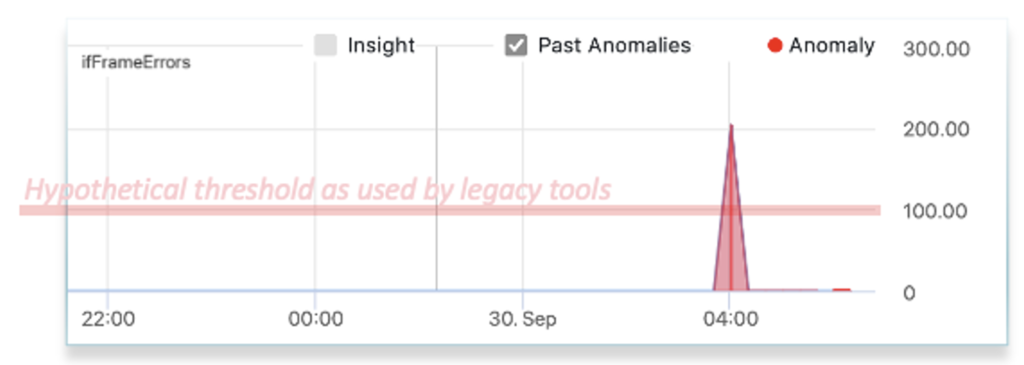
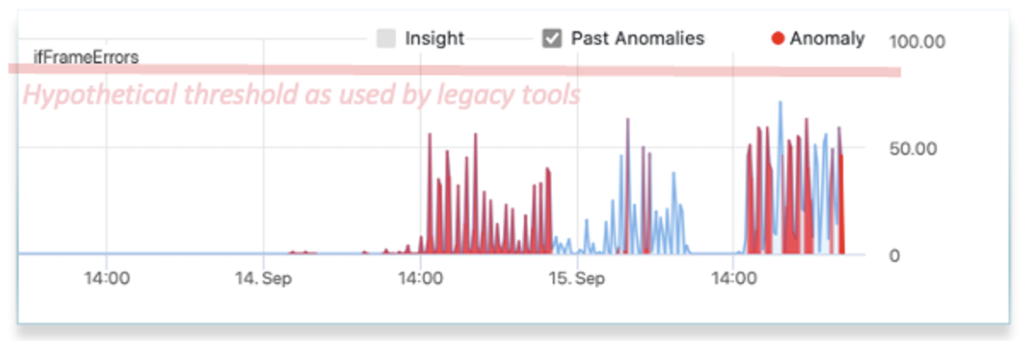
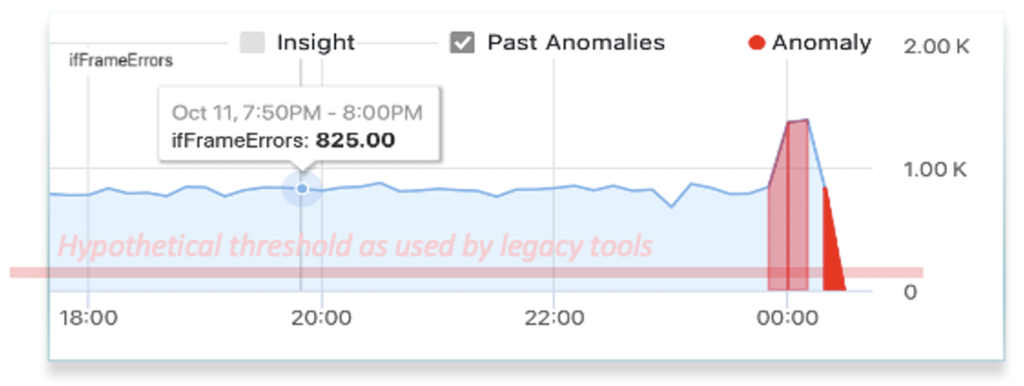
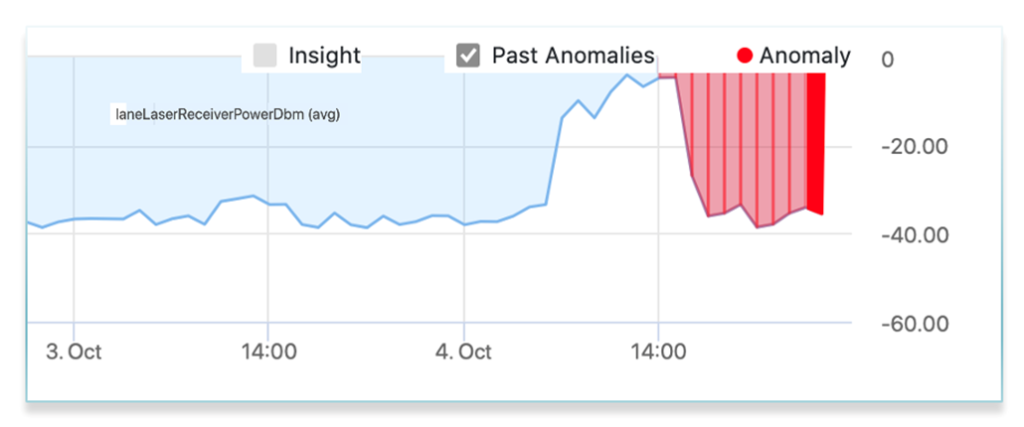
  • Automatic Anomaly Detection:
    • Efficient techniques to detect abnormal behavior within large streams of metric and event data
    • Accuracy to minimize false positives and false negatives.
    • Correlation technique choice has profound consequences in both medical and networking.
  • Real time big data pipeline:
    • We can imagine the impact if all metrics and events could be observed for a human body.
    • While this is not achievable today for medicine, it is for Data Center Networks.
  • Proactive and predictive:

Today, the datacenter “internist” either does not exist, or is powerless. The job that maps best to this role is the Site Reliability Engineer (SRE).

Transforming Data Center Operation Using Internist Attributes

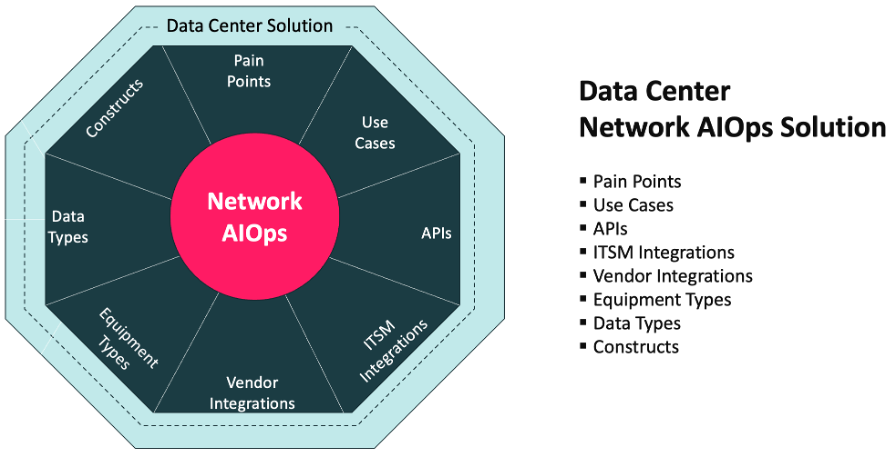
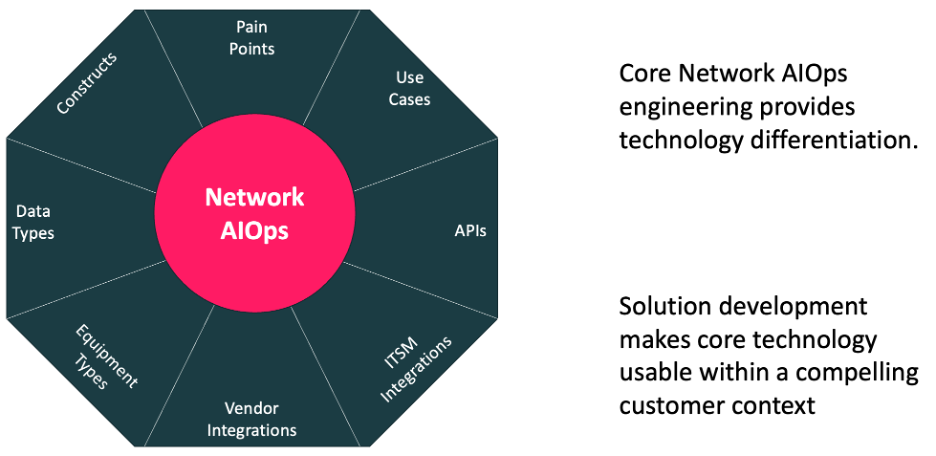
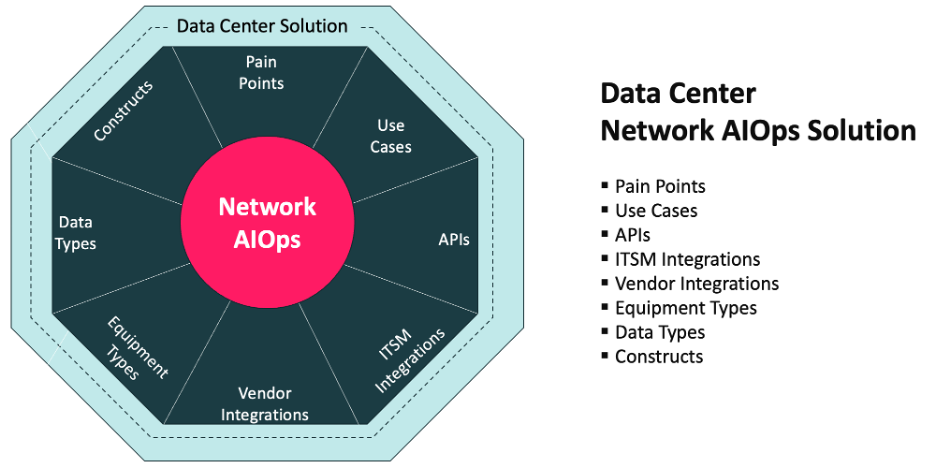
As depicted in Figure 1 below, this analysis leads us to an AI/ML Datacenter Operation Radar Chart that will transform the way we operate datacenter networks to achieve unprecedented goals: automatically finding needles in a haystack, model-based autocorrelation, proactive/predictive observation, and fast troubleshooting reducing time to innocence.

Network transformation is made possible by development of data center network internists, leveraging what has been learned from medical internists.

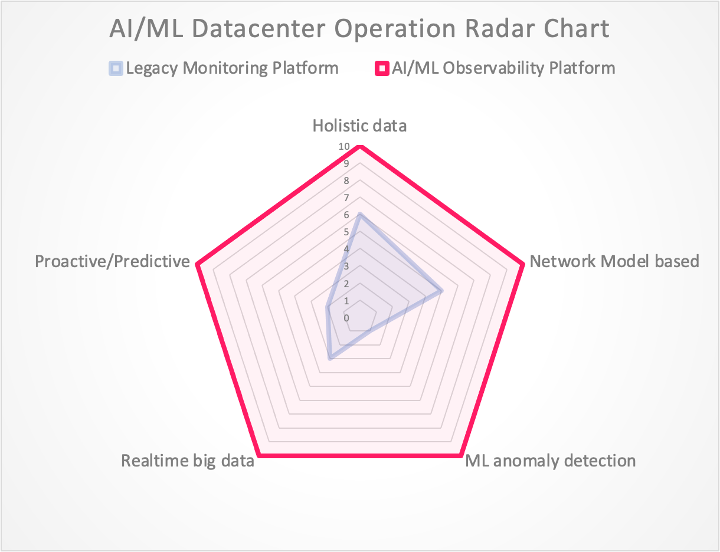
Figure 1: AI/ML Datacenter Operation Radar Chart

This chart also helps us to realize the gaps we have with legacy monitoring platforms and precise evolution objectives as well as market expectations.

Conclusion

Modern data center network architectures have shifted complexity from equipment to operations. As a result, existing approaches to anomaly detection, mitigation, and repair are breaking down. In addition, there is neither the cycles nor the techniques for doing preventive disease control – going from being reactive to proactive and preventative.

Specialist single-organ physicians are critical in medicine. A different skill is required when the problem is more complex than a single organ. SREs play a similar role in networking as does Augtera’s next-generation Network AI platform.

Related


First Data Center Network AIOps Solution

Augtera Networks announces the first holistic Data Center Solution

Palo Alto, CA, July 19, 2022 (businesswire): Augtera Networks, the industry leader in AI/ML-powered Network Operations platforms, today announced the result of 3 years of development and customer partnership, the first holistic Network AIOps Data Center solution.

Augtera Networks Data Center Network AIOps Solution press release based on three years of close development with customers.

“Over the last three years we have partnered with some of the largest Data Center Network Operations teams to refine our solution” said Rahul Aggarwal, Founder and CEO of Augtera Networks. “Our AI/ML algorithms have been specialized for Data Center networks and customers are seeing dramatic improvement in KPIs such as detection, mitigation, and repair. Most importantly, our technology reduces the total number of incidents that are actioned, resulting in operations teams not just running faster, but running smarter and more effectively”.

Augtera Networks Data Center Solution:

  • Addresses the pain points, use cases APIs, ITSM integrations, Equipment/Vendor integrations, data types and constructs specific to Data Centers.
  • Proactive detection of environmental and optical degradation
  • Anomaly detection for aggregates such as a POD, fabric, or Data Center interconnects
  • Fabric, server, and Hybrid Cloud, latency, and loss anomaly detection
  • Flow analysis including Hybrid Cloud
  • Fabric congestion impact on application sessions
  • VXLAN and EVPN underlay / overlay insights including ECMP analysis
  • Firewall and Load Balancer anomalies
  • Multi-vendor support including Arista Networks, Cisco Systems, Juniper Networks, Dell Enterprise SONiC, F5, Palo Alto Networks, VMWare, and any equipment using industry-standard interfaces
  • Integrations including Amazon Web Services, Azure, Google Cloud Platform, ServiceNow, and Slack.

The solution includes capabilities that come standard with all Augtera Networks solutions including:

  • Holistic data ingestion
  • Automated creation of operationally relevant trouble tickets
  • Policy-driven auto-correlation and noise elimination
  • AI/ML-based anomaly & gray failure detection
  • Topology auto discovery
  • Multi-layer, topology-aware, auto-correlation
  • Topology-mapped “Time-machine” visualization of metrics, events, & anomalies
  • Real-Time Syslog anomaly detection including Zero-Day anomalies
  • DevOps friendly APIs

Modern Data Center network architectures have simplified the hardware environment while increasing operations complexity. Operations teams can no longer simply run faster, they cannot find or economically afford enough people to keep up. They must change the way they work, dramatically reducing the number of incidents that are ticketed / actioned. 

This requires attention to workflows, and a multi-layer, multi-vendor understanding of networking. Most importantly, it requires investing time partnering with Data Center teams to develop the needed solution. Only Augtera Networks has done all this in a holistic way. 

For an overview of what the Data Center Solution addresses, see:

https://augtera.com/wp-content/uploads/2022/07/Augtera-Data-Center-Solution-Brief.pdf

For detailed information on the Augtera Networks Data Center solution features and capabilities, see:
https://augtera.com/data-center/

For case study of Fortune 500 Enterprise, see:

https://augtera.com/wp-content/uploads/2022/07/fortune_500_data_center_solution_case_study.pdf

For more information on the Augtera Networks platform:
https://augtera.com/platform/

To contact Augtera Networks for more information or a demonstration, go to:

https://augtera.com/contact-us/

About Augtera Networks

Augtera Networks stops the noise, enables proactive operations, and prevents incidents, for Enterprise and Service Provider networks. The first AI/ML-powered network operations platform, Augtera is being used by hyperscale cloud platforms, financial institutions, communications service providers, managed service providers, and enterprises in multiple verticals. Additional information can be found at www.augtera.com  

###

Data Center Network AIOps Solution Announcement

Today, July 19th, 2022, Augtera Networks announced the first holistic Data Center Network AIOps solution. Press release here.

Data Center Network AIOps Solution

What do we mean by a solution?

We have spent three years working with some of the largest Data Center Network Operations teams to understand their pain points and use cases. We have also listened and implemented support for APIs, ITSM integrations, equipment / vendor integrations, data types, and constructs relevant to Data Center networks. This solution engineering transforms Network AIOps from a technology platform to an integrated part of how a Network Operations team already works, or a vision of how it wants to work. 

Data Center Network AIOps Solution makes core technology usable within a compelling customer context.

Network operations teams are increasingly realizing that the status quo, running faster and faster, is not going to keep pace. Instead, the overall workload for skilled network operations professionals must be decreased. Network AIOps enables this necessary transformation of working smarter and more efficiently.

Data Center Network AIOps Solutions Engineering

There are too many aspects of solution engineering to discuss them all. A quick summary of a few:

  • Data Center constructs such as Top of Rack, Spine, POD, and Data Center Interconnect
  • Common equipment types including switches, routers, load balancers, and firewalls
  • Important vendors, for example Arista Networks, Cisco Systems, Dell Enterprise SONiC, F5, Juniper Networks, and Palo Alto Networks
  • Critical use cases, for instance Optical anomalies, Link flaps or anomalous errors, BGP gray failures and Border router congestion
  • Important ITSM integrations like ServiceNow and Slack.
Data Center Network AIOps Solution is based on the pain points and use cases specific the Data Center

For more information on how the Augtera Networks Data Center Solution is engineered for Data Center network operations, see: Data Center Solutions Brief and the Data Center Solution Page.

Data Center Network AIOps Customer Results

Network AIOps is a transformative approach to anomaly detection, incident root identification, noise / alert / ticket reduction, and auto-mitigation/remediation. Network Operations processes and data go from being manual, reactive, and noisy, to automated, proactive, and operationally relevant. Less incidents require action, future failures can be prevented, routine tasks can be automated, and skilled resources can spend more focused time on the most important incidents, planning, and architecture/design – further reducing future incidents. While many network operations tools become just another data silo adding to the network operations team workload, Network AIOps reduces the overall Network Operations workload.

As a result of adopting Augtera’s Data Center Network AIOps solution, customers have:

  • Reduced mean time to detect (MTTD) / action by 90%+
  • Reduced mean time to mitigation (MTTM) by 50%+
  • Reduced mean time to repair (MTTR) by 40%+
  • Increased mean time between incidents by 4 times

For example, where it may have previously taken over 40 minutes for an engineer to action an incident, it now takes a minute, or less. In addition, there are less incidents to action. This is a dramatic increase in productivity.

Conclusion

Augtera Networks developed the First Network AIOps platform. The platform has evolved through solution engineering to address the specific needs of Data Center Network Operations teams. This is the first holistic Network AIOps solution for Data Center Networks, with capabilities far exceeding previous generation network operations tools.

Network Operations teams are suffering from alert fatigue, increasing complexity, and the inability to differentiate between what is noise and what is operationally relevant. Network AIOps transforms Network Operations from manual, reactive, and noisy to automated, proactive, and relevant.

Augtera’s Network AIOps Data Center Solution – the first and leading solution for Data Center Network Operations teams.

Solution Resources

To learn more about the Augtera Networks Data Center Network AIOps Solution:

Observability Reflections from Monitorama 2022

Observability evolution is constant . The end of June Monitorama conference, in Portland Oregon, was a great event to catch up on the “State of the Nation” in monitoring and observability.

A mostly application/services-oriented conference, the problem statement seemed clear enough “Modern app development broke IT operations”. The same could perhaps be said about network operations, with respect to modern network architectures. In either case, the challenge remains how to manage through something that is here to stay.

Observability Challenges

As with many industry terms, definition debate abounds. However, from my perspective, observability is often defined by two characteristics:

  • The ability to monitor the hardware and software internals.
  • The ability to ask any question about the internals and other data collected.
Observability Reflections from Monitorama and definition.

For applications and networks, data collection has increased dramatically over the last couple of decades. The volume and variety of data as well as the number of things to collect data on. How much data is enough, and how much is too much?

A clear message from speakers and audience at Monitorama was data is expensive, both in financial terms and carbon footprint terms. For usage-based data, example AWS CloudWatch, having multiple tools collect information can amplify cost.  WRT carbon footprint, there was a sense there is a growing sensitivity, with stronger regulatory and industry pressures to come.

In the application segment of observability, one of the potential sources of significant data is tracing. Tracing tracks / observes service requests as they pass through multiple microservices / systems. High transaction rates and numerous micro services can lead to a significant additional data.

Tools remain another challenging area: silos, build vs buy, scale, multi-tenancy, ingest peaks / data store lags. In the area of log management and analytics, these challenges led Slack to drive an Open-Source project called KalDB. Like some other solutions in this segment, KalDB is (Apache) Lucerne based.

Observability Recommendations

The recommendations made during the conference were both implicit and explicit. 

As an example of an implicit recommendation, there was a fascinating presentation by Meta on what they have done internally to automate noise reduction and ticket creation. Meta estimates that automation detects issues 10x earlier than manual methods, for example operations teams looking at dashboards. In addition, a good chunk of Meta alerts can be auto responded to / remediated.

Other speakers talked about the need to create structured logs that more easily supported querying and indexing. Still others asserted that tracing is not always needed, and that many of the same outcomes can be achieved using logs and metrics.

There was certainly a sensibility to carbon footprint issues at Monitorama and implied recommendation that measuring this is something that should be on everyone’s mind.

Augtera Networks Approach

The Augtera Networks platform provides monitoring, observability, AIOps, and automation. We realize that not every operations team is in the same place when it comes to preferences for each of those approaches.

We recognize there are many drivers for efficient and scalable execution, so we optimize both our runtime code choices and algorithms to be as efficient as possible, and we believe much more efficient than other vendors.

Log processing is challenging. We do believe our use of real-time natural language processing significantly reduces some of the log analytics issues other approaches have experienced. Specifically, we can analyze log messages, regardless of the order in which information appears through our semantic understanding.

Conclusion

Every year brings new challenges and new solutions. Both application and network architectures have dramatically changed over the last decade, and legacy approaches are struggling to produce good outcomes for operations teams. Monitoring, especially metric monitoring provides visualizations that provide a certain level of understanding. Observability provides further understanding through the monitoring or internals and the ability to ask questions across multiple data sources. However, both monitoring and observability still entail some manual effort with respect to anomaly detection and mitigation/remediation responses. Approaches like multilayer topology aware correlation, machine learning models for detection, and customer-driven policy provide the foundation for automation.

Monitorama 2022 was a great conference and an excellent opportunity to hear from SREs, Vendors, and others on the state of monitoring, observability, and more.

Related

Simplifying Edge With SONiC, Dell and Augtera

Simplifying edge: “With SONiC [Software for Open Networking in the Cloud], organizations can extend their data center fabric out to edge locations, using a single unified network operating system and the same familiar data center networking tools that they are accustomed to.

Dell Technologies is working with partners like Augtera to provide management solutions for SONiC.

Read More: Simplifying Edge with a Common Network Operating System for Cloud, Enterprise, and Edge.

Dell Technologies and Augtera Network AI

Related:

Machine Learning Anomaly Detection – Beyond Thresholds

Introduction 

Compared to threshold-based anomaly detection, machine learning anomaly detection reduces noise and enables proactive action. A single, static, threshold is difficult to maintain and often nonoptimal from the start. Machine learning, by contrast, learns what is normal for each measured metric, and when optimally honed, only generates operationally relevant alarms. 

Challenge with Thresholds 

The primary challenge with thresholds for anomaly detection is that operators are continually reacting to failures (i.e., the threshold has been crossed and there is an emergency) vs. where they would rather be, which is preventing failures in the first place. 

Anyone who has spent time managing a network has heard complaints like “why is the network slow today? Did you make a change last night?” or “the website is timing out. What is going on with the network?”.  The network is often considered guilty until proven innocent. 

We will illustrate the problems with thresholds, compared to machine learning anomaly detection, with a real life example that network operators in the data center encounter fairly often. It starts with application teams complaining that the “network is slow”. 

In this example, we assume there is a real network issue and things are not “hard down” but rather in a degraded condition.  Where do you look first?  This is where threshold based anomaly detection is deficient. It is designed to catch extreme outliers at the expense of creating significant false positives and noise. It is not designed to find operationally relevant high fidelity changes that may or may not be extreme outliers. 

In addition, thresholds are not feasible for many types of metrics as the operator cannot even guess what threshold to apply. In the example below, what is the right threshold to set for interface frame errors? The first appears to produce a good alarm. The 2nd however will never  alarm even though there is a storm of errors, and the 3rd will continually alarm creating nothing but noise. The reality is that alerts on this metric will not end up getting used by network operations because thresholds on this metric are too difficult to set across the network and require continual manual tuning. Applying thresholds on the ratio of frame errors to the traffic can help in some cases but suffers from similar challenges. 

Both threshold and machine learning anomaly detection will generate an alarm
Both threshold and machine learning anomaly detection will alarm
Machine learning anomaly detection will work better than a threshold that produces false negatives.
Threshold never alarms and therefore is producing false negatives
Machine learning anomaly detection will work better than a threshold continuously alarming false positives.
Threshold will continuously alarm false positives

Now, back to our slow network.  The operator would likely start either at the application or user end of the network and trace the path across the network to attempt to identify where there is congestion or drops.  Once they find a signal, such as less than the usual traffic, they next need to identify the cause.  This will require looking at more data such as control plane metrics, component (e.g. CPU, memory) metrics, or syslog.  This process takes considerable time as the operator must review and eliminate each potential cause and may require multiple teams. We refer to this as “finding the needle in the data haystack” 

Machine Learning Anomaly Detection Introduction 

Machine learning anomaly detection takes a different approach. Augtera’s proprietary ML automatically learns the normal patterns for every interface and device on the network. This includes traffic, discards, errors, optical tx/rx power, queues, CPU, etc. (you get the idea).  The ML is also able to identify anomalies related to changes in route tables, flows, retransmits and even syslog patterns. This deep understanding of the network gives operators advance insight when the network begins to misbehave, not when it has reached a critical level.  It also gives operators visibility to everything of operational relevance that has changed.  

Machine Learning Anomaly Detection Example

Going back to our example of the network slowdown our users reported.  In our hypothetical scenario it was caused by a damaged fiber cable.  A technician recently did maintenance in a data center facility and inadvertently caused an optical impairment which pushed the receive power just outside the spec causing laser clipping, which manifested in interface frame errors and slightly less traffic on the impacted interfaces.  This again, is a very difficult thing for threshold based monitoring, as laser receive power is based on manufacturer specs and not uniform and there is no definitive good or bad value.  It also highlights the value of machine learning. ML anomaly detection will learn the normal receive power for each laser and will be able to detect when the pattern begins to change in an operationally relevant manner. This does require purpose built algorithms for optical metrics.If our operator was using these specialized ML algorithms in their network, they could have detected both the optical degradation and interface frame errors soon after the maintenance and well before users returned the next day. 

machine learning anomaly detection shows past patterns and the anomaly, exceeding the experience of thresholds

Conclusion 

To avoid many false positives, thresholds are often set to catch extreme outliers. This creates another problem, which is false negatives, anomalous conditions that should be given attention. As a result, operations teams do not see emerging problems before they become failures, and therefore, are always being reactive, instead of proactive. 

Machine learning anomaly detection is less noisy and enables operations teams to be proactive. Augtera’s machine learning algorithms have been honed to network patterns, detecting gray failures, before they become hard failures, and adapting to the specific patterns of what is being monitored.  

Related